Bitcoin Price Analysis: $BTC Price To Squeeze Before an Explosive Move; Time to Buy?


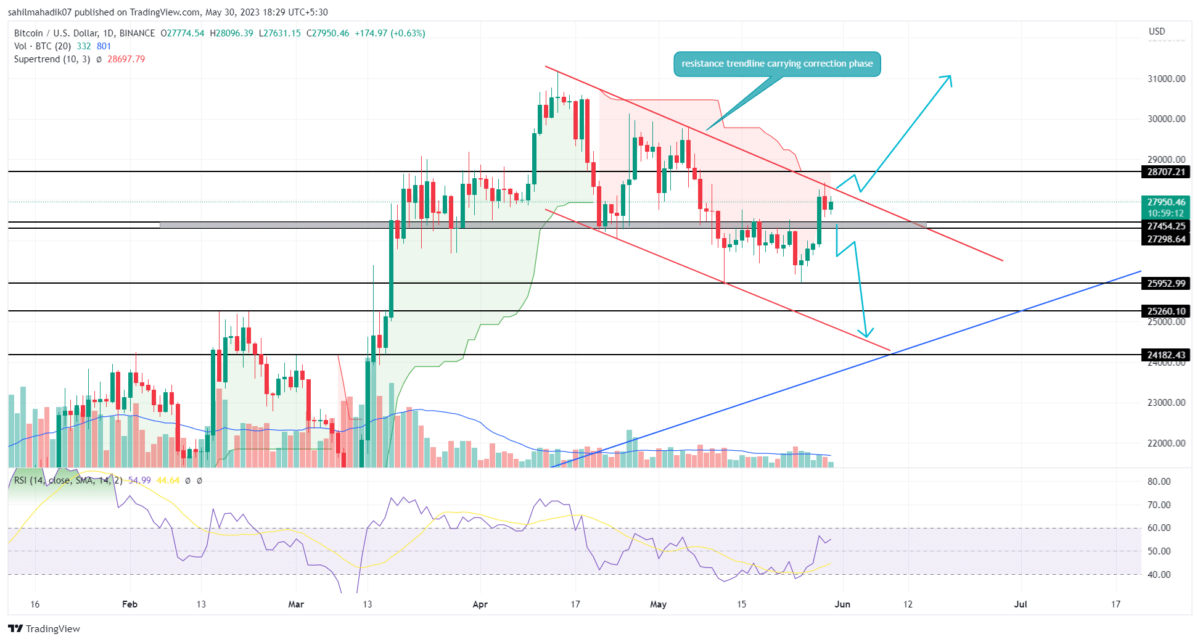
Bitcoin Price Analysis: Amid the ongoing recovery in the crypto market, the Bitcoin price breached a significant resistance zone of $27500-$27300. This breakout was supposed to recuperate the buying momentum and resume the prior recovery but the buyers failed to surpass the immediate resistance trendline of the falling channel pattern. This reversal may reflect the correction is not over for BTC holders.
Also Read: On-chain Data Shows Bitcoin Price Move Past $28k Resistance
Bitcoin Price Daily Chart
- The falling channel pattern keeps the BTC price under the threat for prolong correction
- The breakout above the overhead trending may kickstart a fresh recovery rally
- The intraday trading volume in Bitcoin is $5.68 Billion, indicating a 12.5% loss.
 Source-Tradingview
By the press time, the Bitcoin price trades at $28043 and wobbles between the breached $27500 level and overhead trendline. Both aforementioned levels are strongly influential for BTC price and therefore their breakout could determine the upcoming trend.
As in theory, the falling channel pattern usually bolsters significant growth upon its completion, the current recovery phase in the market, reflecting the BTC price is more likely to break above the resistance trendline.
A daily candle closing above the wedge trendline will boast the underlying bullish momentum and offer a long positional trade for interested buyers. The resulting rally could the BTC price to the last two highs of $31170, registering a potential growth of 11.5%.
On a contrary note, a breakdown below the $$27300, will resume the ongoing correction to the $25000 mark.
Will Bitcoin Price Revist $30000?
Any further recovery in Bitcoin price is dependent on its breakout from the long-coming resistance trendline of the channel pattern. This potential breakout will intently the buying pressure and may push the coin price to a high of
- Supertrend: The trend-defining indicator projecting a red film suggests the market trend remains bearish
- Relative strength indicator: The daily RSI slope is yet to breach 60% of a market project the buyer needs higher momentum to retake trend control.

Why Trust CoinGape
CoinGape has covered the cryptocurrency industry since 2017, aiming to provide informative insights Read more…to our readers. Our journal analysts bring years of experience in market analysis and blockchain technology to ensure factual accuracy and balanced reporting. By following our Editorial Policy, our writers verify every source, fact-check each story, rely on reputable sources, and attribute quotes and media correctly. We also follow a rigorous Review Methodology when evaluating exchanges and tools. From emerging blockchain projects and coin launches to industry events and technical developments, we cover all facets of the digital asset space with unwavering commitment to timely, relevant information.

Related Articles


- Morgan Stanley, Other TradFi Load Up SOL as Solana RWA Tokenized Value Hits $1.66B ATH
- Trump’s WLFI Slides 8% as Senators Tell Bessent To Review World Liberty’s UAE Stake
- XRP Price Slides Under $1.5 Amid $50M Market Dump on Upbit
- Is Bitcoin Bottom Still Far Away as Matrixport Says More Bear Market Signals Are Emerging?
- Dalio’s Warning on World Order Sparks Fresh Bullish Outlook for Crypto Market
- XRP Price Prediction Ahead of Supreme Court Trump Tariff Ruling
- Crypto Price Prediction For This Week: Dogecoin, Solana and Cardano
- Bitcoin Price Prediction: How Could Brazil’s Strategic Bitcoin Reserve Proposal Impact BTC?
- 3 Top Reasons Pi Network Price Surging Today (14 Feb)
- XRP Price Prediction Ahead of Potential U.S. Government Shutdown Today
- Bitcoin Price Outlook As Gold And Silver Lose $3.6 Trillion in Market Value


