Bitcoin Price Analysis: BTC Still Not Out Of Wood As Struggles Near $23,000


Bitcoin price analysis shows a neutral outlook. As the price continues to consolidate near the $23,000 mark. The extended consolidation makes investors nervous as the fight between bulls & bears continues. The largest cryptocurrency by the market cap trades with modest gains on Wednesday. As of writing, BTC/USD trades at $22,889, up 0.31%. The bulls failed to capitalize on the late buying in the previous session. And, trades in $23,200 and $22, 800 narrow trading range.
On the daily chart, the price retraced after testing the highs and continued its upward journey. On July 8 and July 20 the price tested fresh highs and immediately fell into a corrective pullback. We can see the replication of the previous price pattern. After testing, the swing highs of $24,666 on July 30, BTC faced a pullback. Further, the price could correct up to $22,500. That could be a discount buying opportunity.
- Bitcoin price offers no surprises as it remained offered near $23,000.
- A bounce back is expected if the bulls manage to hold $22,800-$22,500 support zone.
- However, a fall out below $22,200 would invalidate any bullish argument.
BTC price displays consolidation
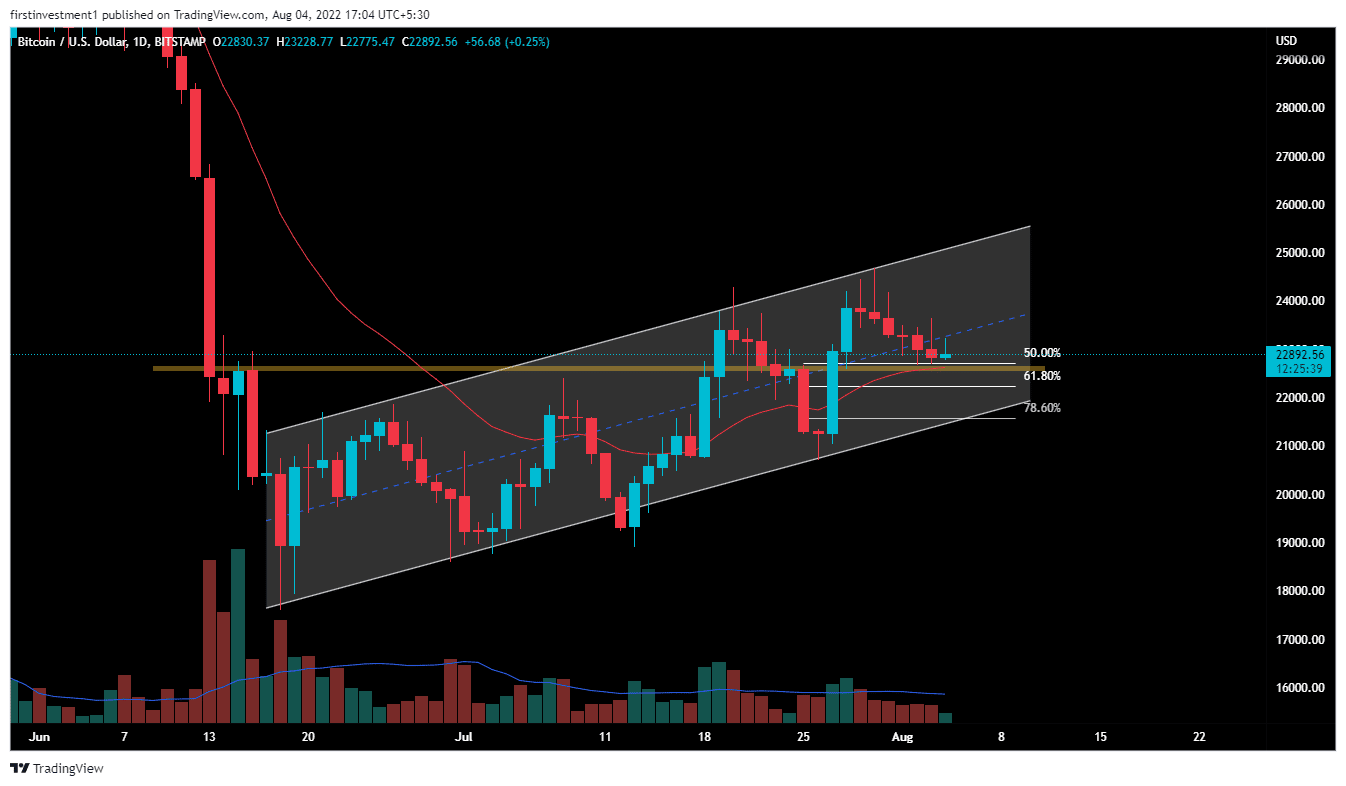
BTC price is trading in an ascending channel, making higher highs and higher lows on a daily basis. Currently, the price is hovering near the 20-day EMA for the last three days. Thus, making it a crucial level to trade.
After giving an impulse move from $20,700 to $24,670, BTC’s price takes a retracement from a higher level to the 50% Fibonacci level, which is at $22,700.
The daily chart shows BTC’s price makes a crucial support zone that extends from $22,700 to $22,500. At the same time, the nearest resistance is at $23,200. If the price is able to close above $23,200, with good volumes then we can expect a good to bullish momentum up to the highs at $24,600.
On the contrary, a spike in sell orders could blow out the low of July 24 at $22,260. On moving lower, the sellers could test $21,500.
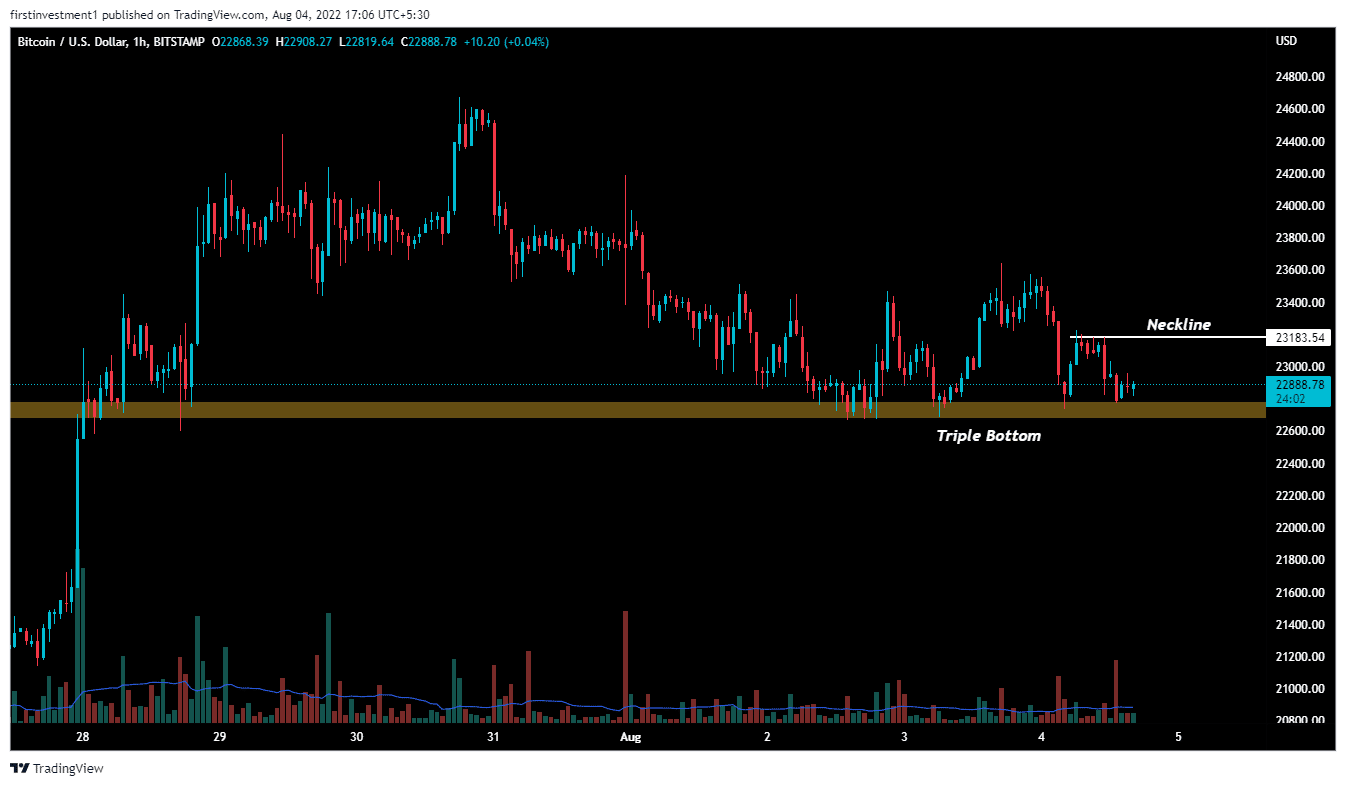
On the hourly time frame, the price formed a “Triple Bottom pattern” indicating strong support on lower levels. According to this pattern, If the price breaks its neckline on the higher level above $23,200 with good volumes, then the expected upside momentum in BTC price can go above $23,500 to $23,750.
On the other hand, a break below the $22,650 level could invalidate the bullish outlook. And the price can be below $22,200
BTC is bullish on all time frames. Above $23,200 closing on the hourly time frame, we can put a trade on the buy side.

Why Trust CoinGape
CoinGape has covered the cryptocurrency industry since 2017, aiming to provide informative insights Read more…to our readers. Our journal analysts bring years of experience in market analysis and blockchain technology to ensure factual accuracy and balanced reporting. By following our Editorial Policy, our writers verify every source, fact-check each story, rely on reputable sources, and attribute quotes and media correctly. We also follow a rigorous Review Methodology when evaluating exchanges and tools. From emerging blockchain projects and coin launches to industry events and technical developments, we cover all facets of the digital asset space with unwavering commitment to timely, relevant information.
Premium Partners


Related Articles


- Fed Chair Drama Heats Up as Trump Eyes Christopher Waller Amid “Lower Rate” Ambitions
- Hyperliquid Eyes HYPE Token Recovery with Massive Burn Proposal
- Bitcoin Crash Incoming? Peter Schiff Adds to Bearish Warnings as Gold and Silver Rally
- Bitcoin to Drop to $10K? Bloomberg Analyst Makes Bold Prediction
- U.S. Banks May Soon Issue Stablecoins as FDIC Proposes GENIUS Act Framework
- Solana Price Outlook After Charles Schwab Adds SOL Futures — What Next?
- Pi Network Stares at a 20% Crash as Whale Buying Pauses and Demand Dries
- Here’s How Dogecoin Price Could Rise After Crossing $0.20
- Is XRP Price Headed for $1.5 as Whales Dump 1.18B XRP in Just Four Weeks?
- Bitcoin Price Weekly Forecast as Gold’s Surge Revives Inverse Correlation — Is $85K Next?
- Ethereum Price Risks $2,600 Drop Despite JPMorgan’s New Fund on its Network


