Bitcoin Price Analysis: BTC Struggles Below $24,000; Is Reversal On The Cards?

The Bitcoin price analysis shows a sideways movement with a negative bias. BTC buyers meet suppressive impetus near the crucial $24,000 mark. The price made multiple attempts near the resistance level making it a crucial level to trade.
As of press time, BTC/USD is exchanging hands at $23,866, down 0.97% for the day. The 24-hour trading volume of the biggest cryptocurrency fell more than 13% to $28,102,530,268. A declining volume with a negative price is a sign of consolidation.
- Bitcoin price extends the consolidation for the last three days.
- A rising wedge pattern warns of a deep correction.
- A decisive break below $23,500 would induce more pain in the coin.
Bitcoin price trades sideways

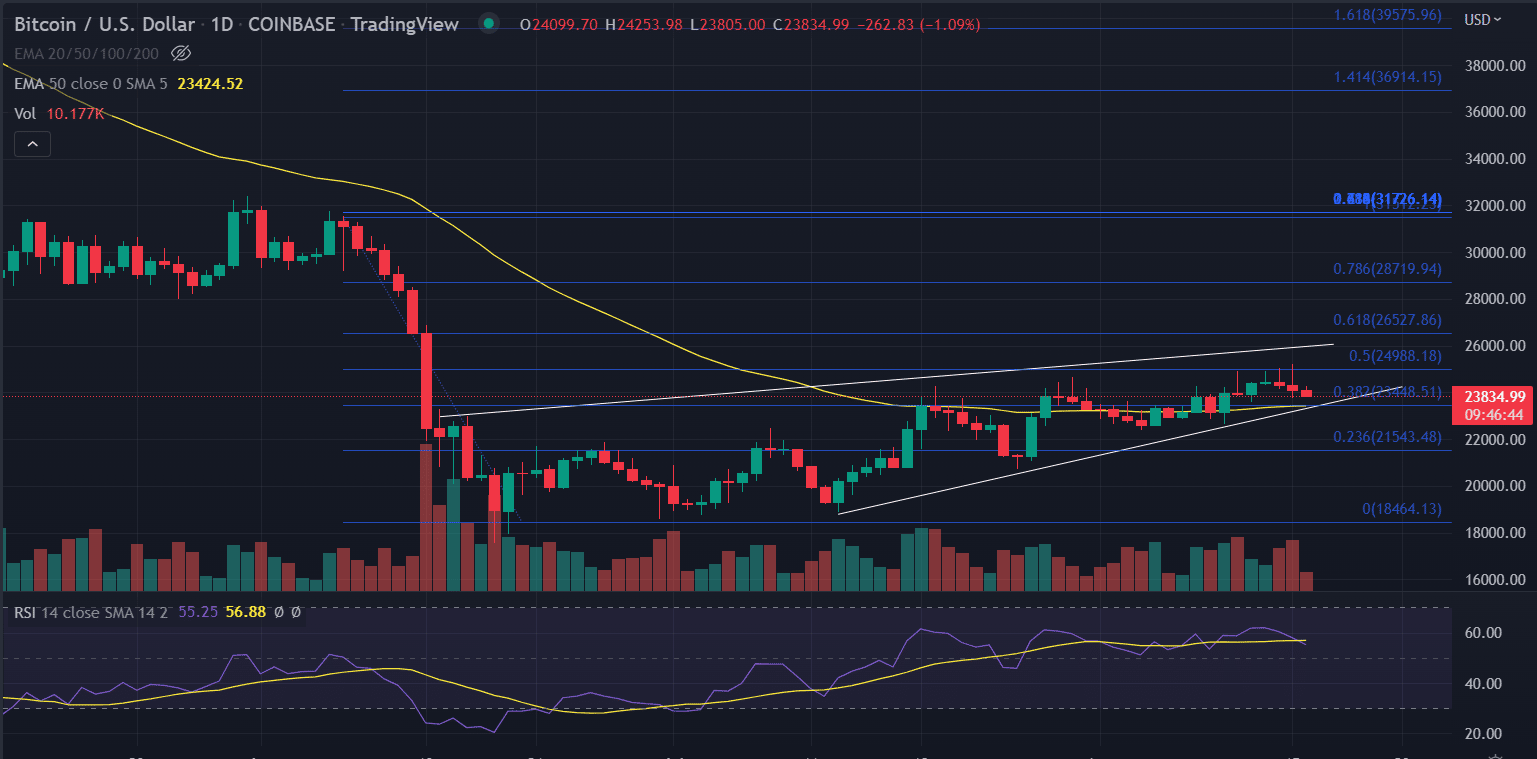
On the daily chart, the Bitcoin price analysis shows a negative bias. BTC is trading in a “Rising Wedge” Pattern. A rising wedge is generally a bearish signal as it indicates a possible reversal during an uptrend. Rising wedge patterns indicate the likelihood of falling prices after a breakout through the lower trend line.
According to this pattern, if the price is able to close below the structured rising support line, then the price takes a turnaround to bearish momentum from bullish momentum. The expected fall in BTC could be expected around $21,300, which also acts as a previous swing low, and a 50% Fibonacci Retrecamnet of the impulse move from $17,671 to $24,900 started from June 18 – Aug. 11.
The volumes are declining, with the rising price of BTC, which implies worrisome. When the market is rising while volume is declining, the big money is not the one buying, more likely slowly exiting positions.
The real question is that the Big players have exited from this recent move, and now, again come with selling?
If the price closes below 23,660, then this bullish move will take another course on the continuing trend of the long-term frame which is clearly Bearish.
For, more than five days, the price is closed above $24,000, but seeing only rejection or indecisive candles, indicating no movement on the higher side, nor the buyer is ready to take the price up. The price takes a heavy rejection around $25,000 and then started to fall.
4-hour chart trims gains

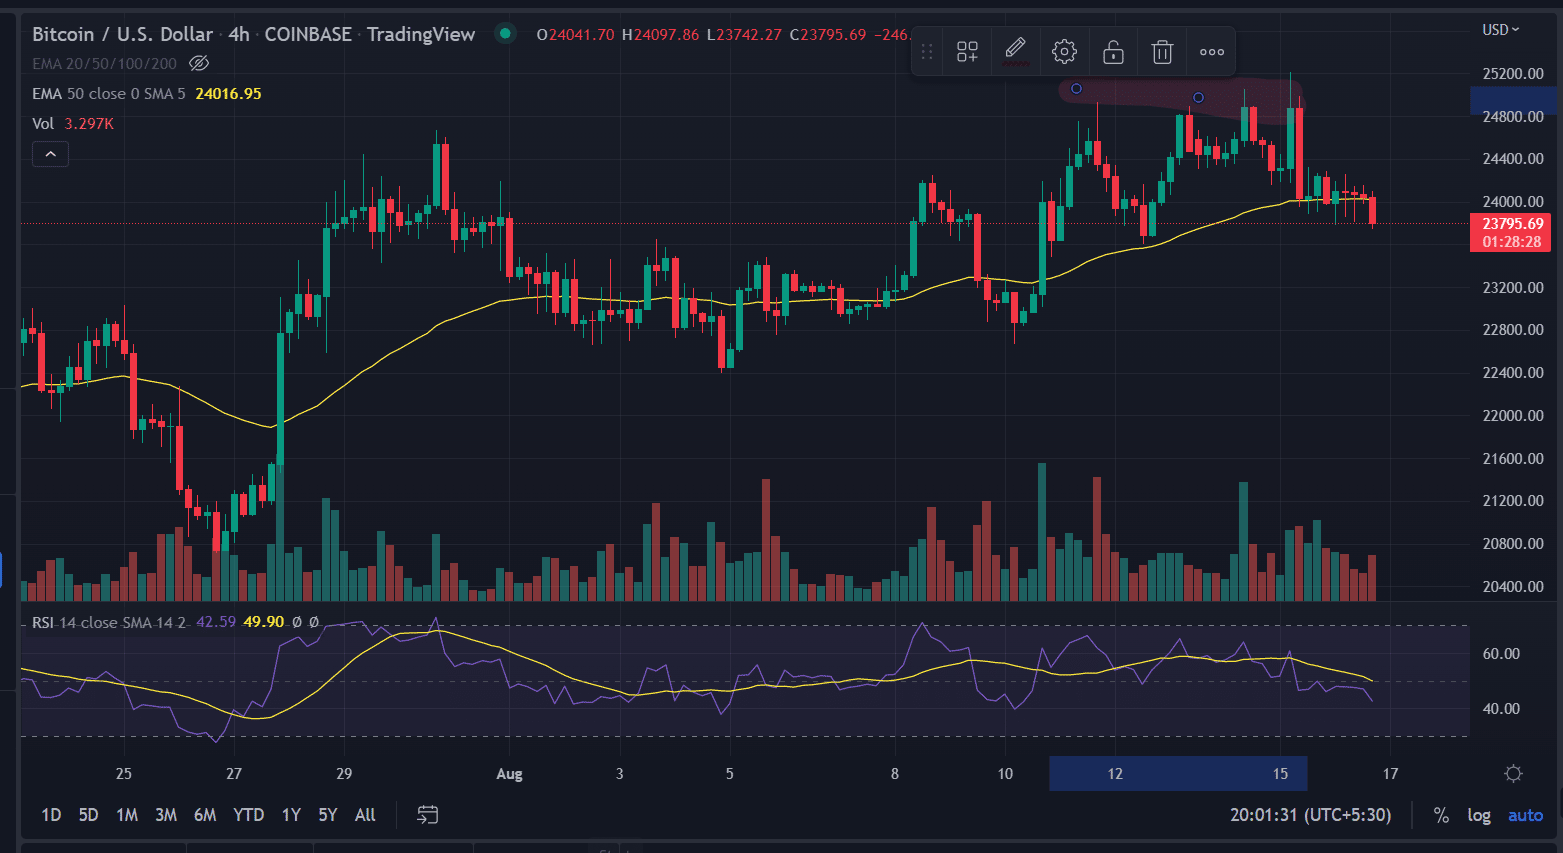
On the four-hour chart BTC still making higher highs and higher lows, but the new highs are at just rection candles, not bullish ones, even making a “Triple Top” pattern-like structure which is the reason, why a heavy sell-off is not happening yet. When the price breaks its recent swing low, on the lower side then we can expect a good fall.
Also read: https://Bitcoin (BTC) Will Test Support Below $10,000 Predicts Peter Schiff
On the other hand, a break above the $24,560 level could invalidate the bearish outlook. And the price can be above $26,200
BTC is bearish on all time frames. Below $23,660 closing on the hourly time frame, we can put a trade on the sell side.
- Breaking: Bitcoin Bounces as U.S. House Passes Bill To End Government Shutdown
- Why Is The BTC Price Down Today?
- XRP’s DeFi Utility Expands as Flare Introduces Modular Lending for XRP
- Why Michael Saylor Still Says Buy Bitcoin and Hold?
- Crypto ETF News: BNB Gets Institutional Boost as Binance Coin Replaces Cardano In Grayscale’s GDLC Fund
- Ondo Price Prediction as MetaMask Integrates 200+ Tokenized U.S. Stocks
- XRP Price Risks Slide to $1 Amid Slumping XRPL Metrics and Burn Rate
- Gold and Silver Prices Turn Parabolic in One Day: Will Bitcoin Mirror the Move?
- Cardano Price Prediction as the Planned CME’s ADA Futures Launch Nears
- HYPE Price Outlook After Hyperliquid’s HIP-4 Rollout Sparks Prediction-Style Trading Boom
- Top 3 Meme coin Price Prediction: Dogecoin, Shiba Inu And MemeCore Ahead of Market Recovery


