 Claim Card
Bitcoin Price Analysis: BTC Trades Below 50-day EMA; More Downside In Offer?


Bitcoin price analysis indicates bearishness in today’s session. As the price fell below the $23,000 mark, the price is trading with lackluster motion due to a lack of volatility. The total crypto market cap moved above $1 Trillion according to the CoinMarketCap.
- BTC’s price fell for the fifth straight session after a weak start to the new series.
- A fall below the 50-day EMA signifies the continuation of the downside movement.
- A daily candlestick above $23, 500 would invalidate any bearish argument.
As of writing, the largest cryptocurrency by market cap is trading at $$22,980, down 1.39% for the day. The 24-hour trading volume rose more than 14% to $27,438,288,578. It is a bearish sign.
BTC price extends downside momentum
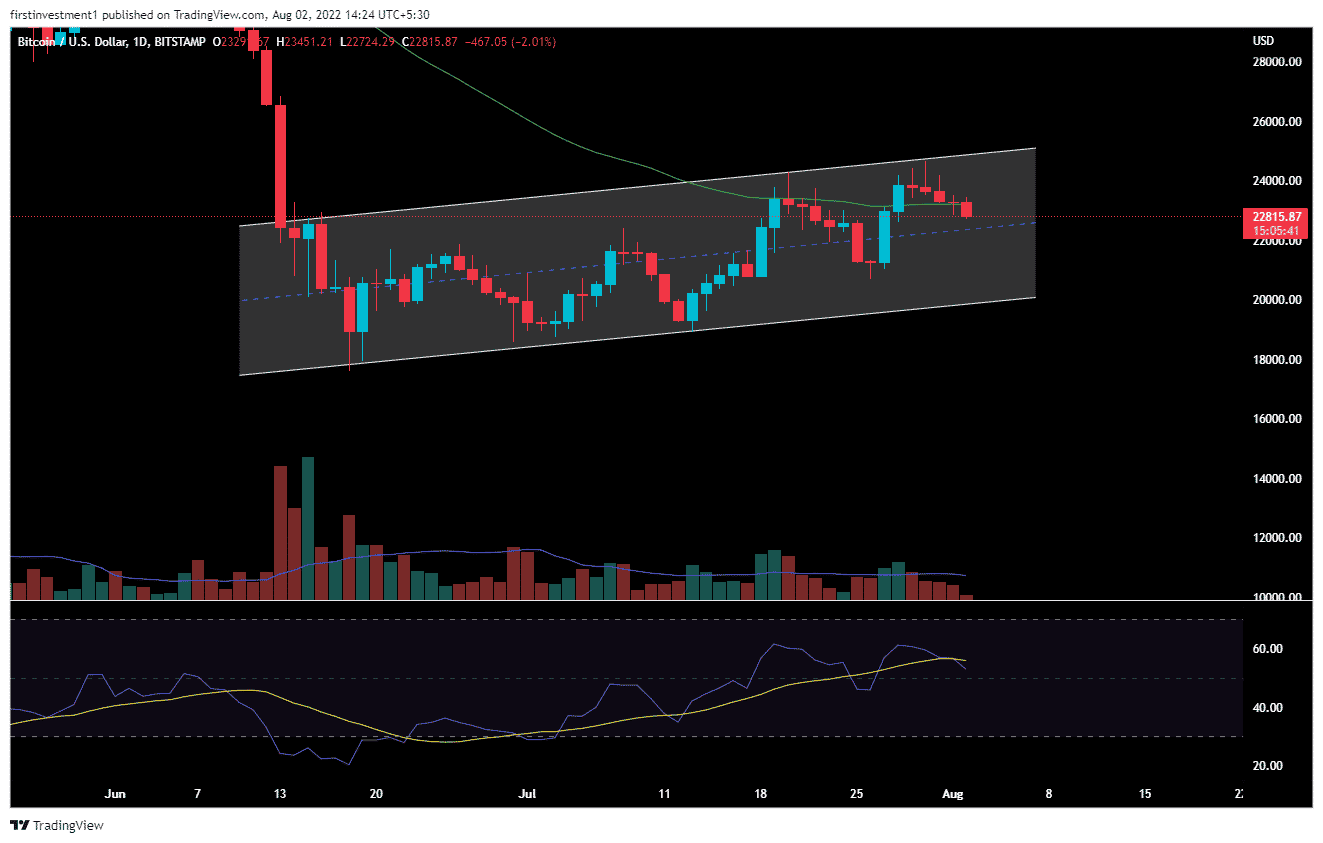
BTC price is trading in a rising wedge pattern, a bearish continuation pattern. Currently, the price faces rejection near the higher levels around $23,850.Earlier, the price moved and closed above the 50-day moving average, but couldn’t sustain above and now started to fall below with a bearish candle. The volumes are also below average indicating that the price might ignore any bullish sentiment as of now.
A daily close below the critical $22,000 level would bring more losses to the coin. On moving lower, BTC sellers would target the low of July 27 at $21,045. Further, if the price is not able to sustain the mentioned level then it might ends up in trend reversal.
The daily chart shows BTC’s price faces a strong resistance hurdle from $23,230 to $23,350.
The RSI(14) breached below the midline with a bearish bias. Currently, it reads at 58.
Lack of volume and volatility shows that the large players are not active in the market. The BTC/USD pair is unable to breach the $24,000 barrier.
1-hour chart forms a bearish pattern
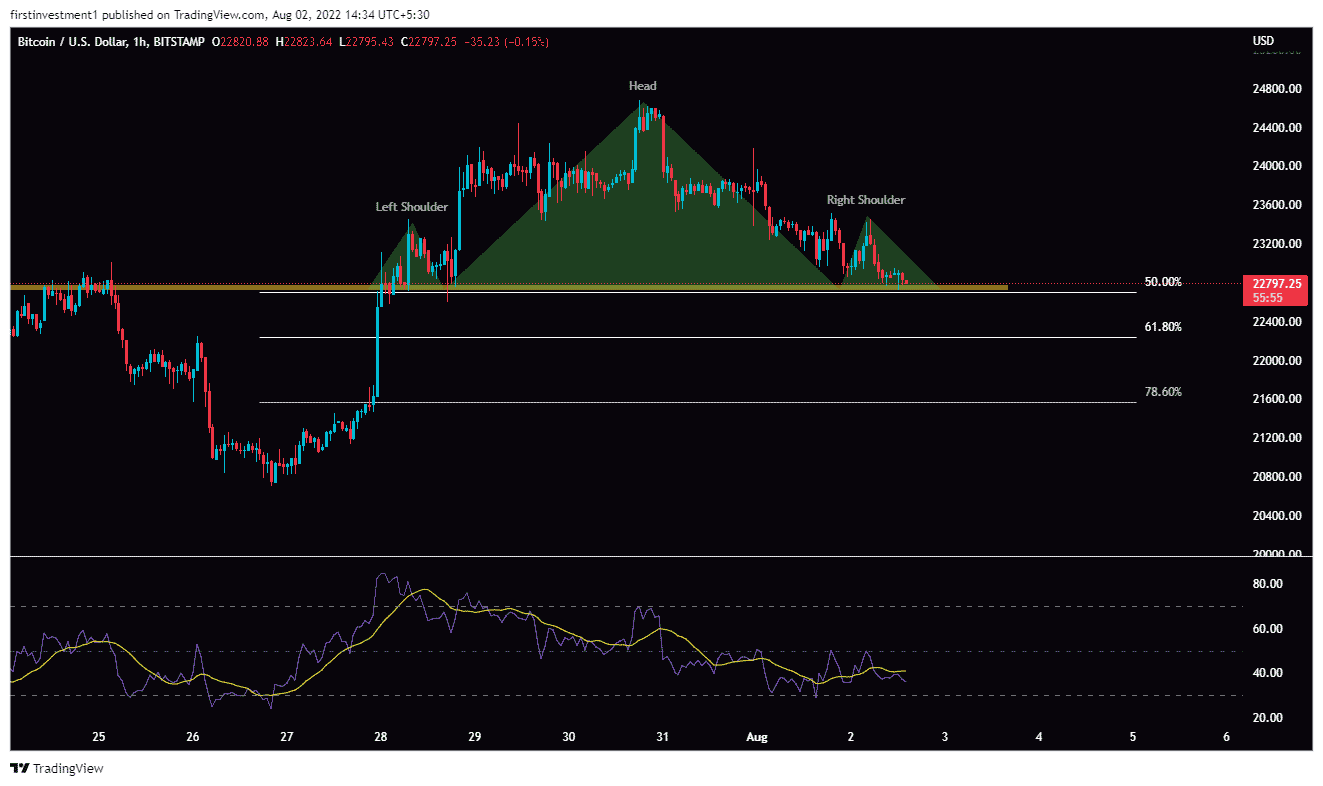
On the hourly time frame, the price formed a ‘Head & Shoulder’ pattern, indicating bearishness. According to this pattern, if the price descends below $22,600, then we can expect a further fall in the price. BTC price can test $22,400 followed by $22,000.
On the other hand, a break above the $23,500 level could invalidate the bearish outlook. This would mean the emergence of buying near the lower level and would aim for $24,000. The buying could motivate the BTC buyers to take out the $22,500 mark.
Conclusion:
Bitcoin price analysis shows that the price is bearish in all time frames. Any uptick in the price could be capitalized to initiate a short position at least in the short term.

Why Trust CoinGape
CoinGape has covered the cryptocurrency industry since 2017, aiming to provide informative insights Read more…to our readers. Our journal analysts bring years of experience in market analysis and blockchain technology to ensure factual accuracy and balanced reporting. By following our Editorial Policy, our writers verify every source, fact-check each story, rely on reputable sources, and attribute quotes and media correctly. We also follow a rigorous Review Methodology when evaluating exchanges and tools. From emerging blockchain projects and coin launches to industry events and technical developments, we cover all facets of the digital asset space with unwavering commitment to timely, relevant information.

Related Articles


- Peter Schiff Casts Doubt on Bitcoin Rally Ahead of Trump’s SOTU Speech
- Putin Signs Law to Confiscate Bitcoin Amid Russia’s Crypto Crackdown, Pavel Durov Probe
- Michael Saylor’s Strategy Moves $83M in Bitcoin as $9B Paper Losses Raises Pressure
- Stripe Eyes PayPal Acquisition Amid Stablecoin Expansion
- Expert Predicts Deeper Bitcoin Decline as JPMorgan CEO Warns of Similarities to the 2008 Financial Crisis
- Cardano Price Signals Rebound as Whales Accumulate 819M ADA
- Sui Price Eyes Recovery as Third Spot SUI ETF Debuts on Nasdaq
- Pi Network Price Eyes a 30% Jump as Migrations Jumps to 16M
- Will Ethereum Price Dip to $1,500 as Vitalik Buterin Continues Selling ETH?
- XRP Price Outlook as Clarity Act Passage Odds Plunge to 53%
- COIN Stock Risks Crashing to $100 as Odds of US Striking Iran Jump


