Bitcoin Price Analysis: Bull Traps Puts $BTC Price at Risk of Prolong Correction
Affected by the massive growth of the 5th largest cryptocurrency XRP, the leading coin Bitcoin witnessed intense buying pressure on July 13th. With a strong bullish candle, the buyers breached the range resistance of $31500, luring awaited buyers for the potential of uptrend continuation. However, the buyers could sustain higher prices which lead to a massive red undermining the bullish thesis. What’s next?
Also Read: Bitcoin (BTC) Set For $35000, Ethereum (ETH) Above $2000 As US CPI Inflation Falls
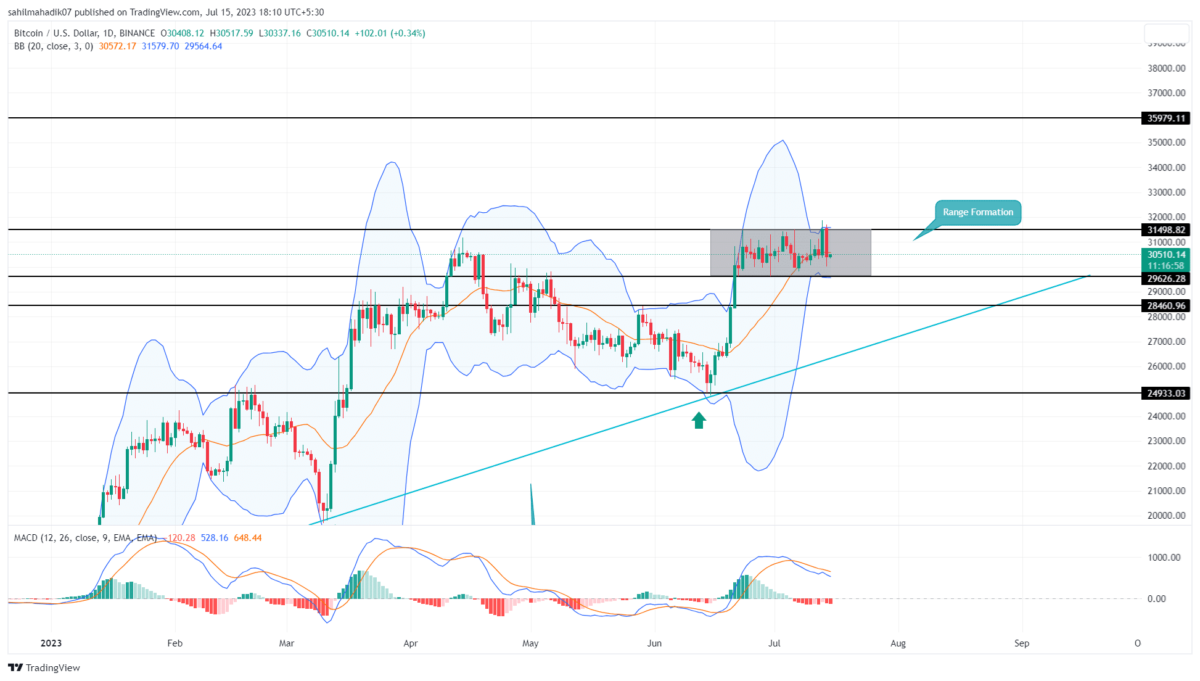
Bitcoin Price Daily Chart
- The $31500 level persists as a strong resistance zone for the BTC price.
- The 20-day EMA dynamic support maintains a high momentum recovery
- The intraday trading volume in Bitcoin is $17.3 Billion, indicating a 34% loss.
On July 14th, the Bitcoin price projected a long red candle that engulfed the buyer’s candle used to break the $13500 barrier. The sellers’ candles destroyed buyers’ weapons of breakout indicating a scenario of a bull trap which may flood more supply pressure as hasty buyers may get liquidated.
Thus, the coin price reenters the range boundaries stretched from $31500 to $29630. The Bitcoin price currently trades at $30461, but with sustaining selling it could plunge 2.75% to reach $29630 support
The price behavior at the aforementioned support would be crucial to check whether the prevailing recovery is intact, or whether BTC could witness a longer correction to $28460.
[converter id=”btc-bitcoin” url=”https://coingape.com/price/converter/btc-to-usd/”]
When BTC Price Can Escape the Sideways Trend?
The fake breakout from $31500 accentuated this level as a high supply zone. On the other hand, if the BTC price showed sustainability above $29630 in the coming days, the coin holders could witness a prolonged sideways trend. Therefore, a genuine breakout from either of the range pattern is needed to determine the near future trend for Bitcoin.
- Bollinger Bands: The upper and lower band of the BB indicator aligned with range levels gives extra weightage to them.
- Moving Average Convergence Divergence: The MACD indicator slope in a negative crossover state indicates the sellers actively influencing the Bitcoin price.
Recent Posts
- Price Analysis
Will Solana Price Hit $150 as Mangocueticals Partners With Cube Group on $100M SOL Treasury?
Solana price remains a focal point as it responds to both institutional alignment and shifting…
- Price Analysis
SUI Price Forecast After Bitwise Filed for SUI ETF With U.S. SEC – Is $3 Next?
SUI price remains positioned at a critical intersection of regulatory positioning and technical structure. Recent…
- Price Analysis
Bitcoin Price Alarming Pattern Points to a Dip to $80k as $2.7b Options Expires Today
Bitcoin price rebounded by 3% today, Dec. 19, reaching a high of $87,960. This rise…
- Price Analysis
Dogecoin Price Prediction Points to $0.20 Rebound as Coinbase Launches Regulated DOGE Futures
Dogecoin price has gone back to the spotlight as it responds to the growing derivatives…
- Price Analysis
Pi Coin Price Prediction as Expert Warns Bitcoin May Hit $70k After BoJ Rate Hike
Pi Coin price rose by 1.05% today, Dec. 18, mirroring the performance of Bitcoin and…
- Price Analysis
Cardano Price Outlook: Will the NIGHT Token Demand Surge Trigger a Rebound?
Cardano price has entered a decisive phase as NIGHT token liquidity rotation intersects with structural…