Bitcoin Price Analysis: Bulls Aims For Three-Month Highs Above $26,000


Bitcoin price analysis signifies the uptrend remains intact in the largest cryptocurrency by market cap. The price opened on a muted note bias but picked up the momentum and tested the highs of $24,898.91.
The price is trading in red for the past few hours as faces rejection near the double top formation around $24,900.
However, the buyers are looking for support toward the 20-day exponential moving average on the hourly chart. The broadening pattern implies swing price movement with high volatility.
- Bitcoin price extends the gains for the second straight session.
- A corrective pullback could drag the price toward $24,200.
- A daily candlestick above $24,900 would bring more gains in the coin.
The bitcoin Fear and Greed Index rose 4 points to 46 from 42 in the last trading session. It indicates the bearish sentiment subsidizes to a certain percentage. But the upside concern is still valid until further price confirmation arrived.
BTC price contracts upside momentum
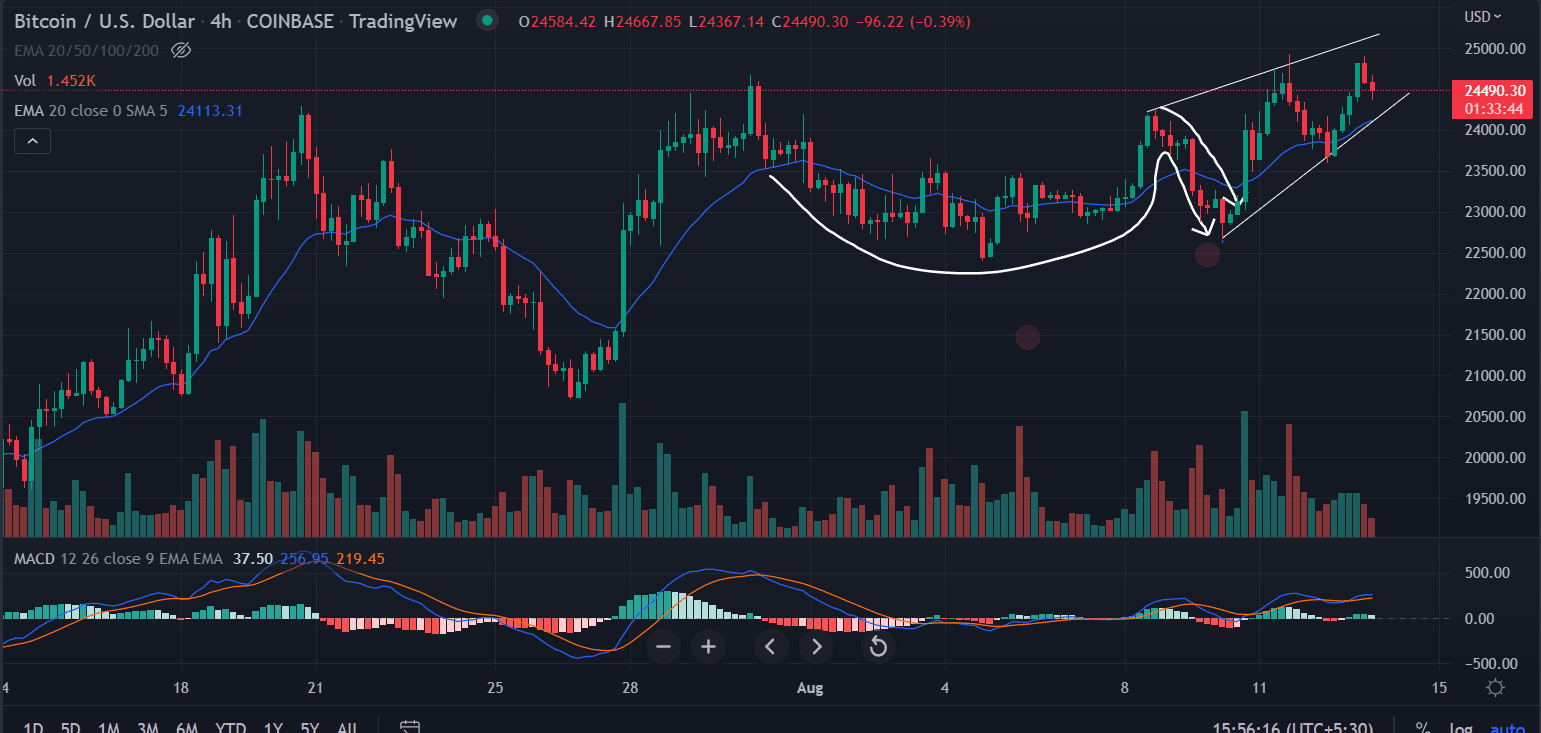
On the four chart, the Bitcoin price analysis shows slowing upside momentum. The formation of “Cup & Handle” formation, which is a bullish pattern indicates the price has the potential to carry forward the gains.
After making a low of $22,669, the price formed a swing high around $24,929.99 on August 11. Since then BTC formed a lower low at $23,600.01.
In today’s session, the Bitcoin price formed a lower low at $24,898.91. The double top-formation resulted in immediate price retracement
The bulls must hold $24,356.11 to be in the game on the four-hour chart. Further, an additional buying pressure could break the double top structure near $24,900. If that happens then the gates would be open for the high of June 13 at $26,895.84.
The Moving Average Convergence Divergence (MACD) holds above the mid-line with a bullish crossover. Any uptick in the indicator would strengthen the bullish outlook.
On the flip side, a break below the 20-day moving average would challenge the prevailing trend. On moving lower, the bears would first tag $23,500 followed by the lows of August 10 at $22,664.69
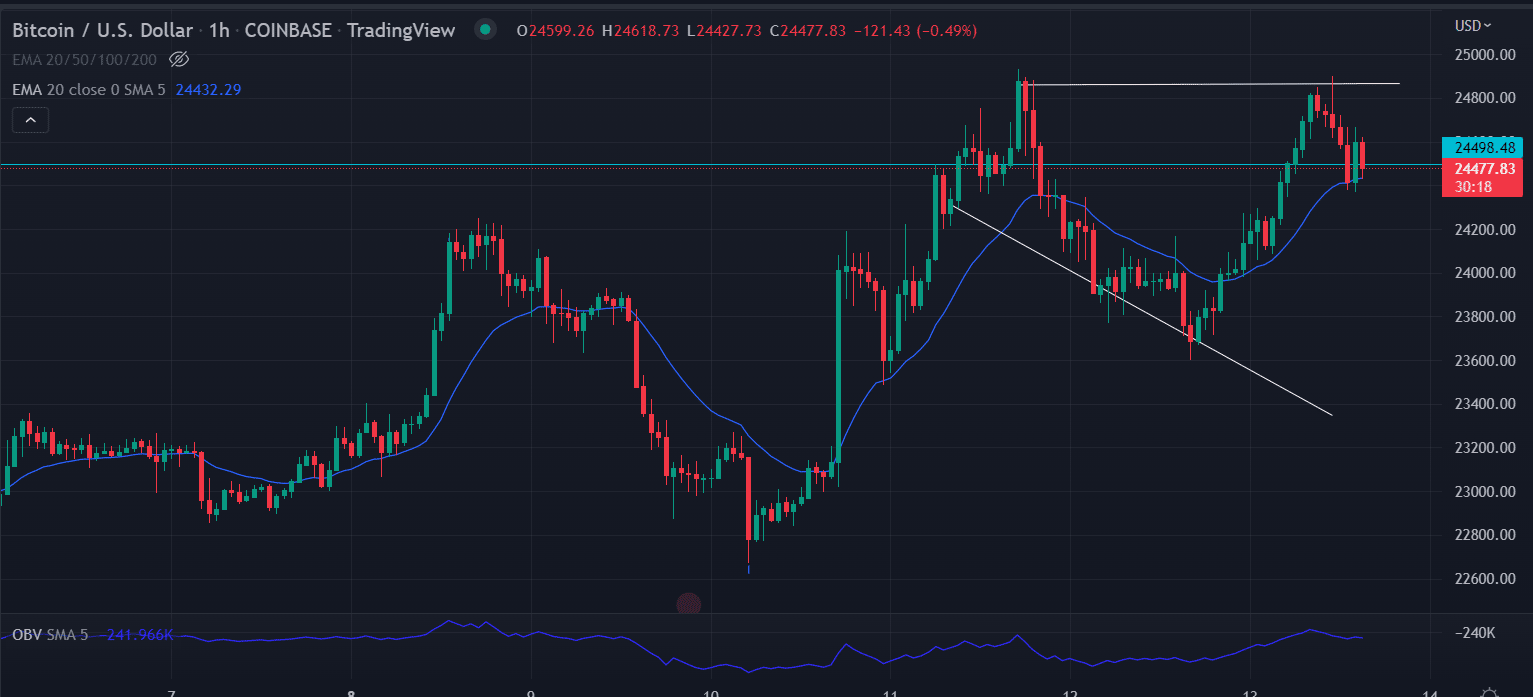
On the hourly time frame, the price formed a broadening pattern. A wide price movement is expected on either side.
A move above the 20-day EMA would pave the way for the next horizontal resistance zone at $24,900.
Also Read: https://After Coinbase Deal, Blackrock Launches Bitcoin Private Trust
The On Balance Volume (OBV) indicator fell as the price slows down and rises along the price. It indicates the participating volume with the rise in price.
As of publication time, BTC/USD is reading at $24,430, up 0.09% for the day. The trading volume declined 17% at $26,060,872,683 according to CoinMarketCap data.
Support: $24,000
Resistance: $25,200

Why Trust CoinGape
CoinGape has covered the cryptocurrency industry since 2017, aiming to provide informative insights Read more…to our readers. Our journal analysts bring years of experience in market analysis and blockchain technology to ensure factual accuracy and balanced reporting. By following our Editorial Policy, our writers verify every source, fact-check each story, rely on reputable sources, and attribute quotes and media correctly. We also follow a rigorous Review Methodology when evaluating exchanges and tools. From emerging blockchain projects and coin launches to industry events and technical developments, we cover all facets of the digital asset space with unwavering commitment to timely, relevant information.

Related Articles


- Bitcoin Shows Greater Weakness Than Post-LUNA Crash; Is a Crash Below $60K Next?
- XRP Tops BTC, ETH in Institutional Flows As Standard Chartered Lowers 2026 Forecasts
- Bitcoin vs. Gold: Expert Predicts BTC’s Underperformance as Options Traders Price in $20K Gold Target
- CLARITY Act: White House to Hold Another Meeting as Crypto and Banks Stall on Stablecoin Yield Deal
- Bitcoin as ‘Neutral Global Collateral’? Expert Reveals How BTC Price Could Reach $50M
- Dogecoin, Shiba Inu, Pepe Coin Price Predictions As BTC Crashes Below $68k
- Ethereum Price Outlook as Harvard Shifts Focus from Bitcoin to ETH ETF
- HOOD and COIN Stock Price Forecast as Expert Predicts Bitcoin Price Crash to $10k
- XRP Price Prediction Ahead of Supreme Court Trump Tariff Ruling
- Crypto Price Prediction For This Week: Dogecoin, Solana and Cardano
- Bitcoin Price Prediction: How Could Brazil’s Strategic Bitcoin Reserve Proposal Impact BTC?


