Bitcoin Price Analysis: Can $BTC Bulls Anticipate $30000 Breakout in Current Recovery?
Bitcoin Price Analysis: The Bitcoin price initiated a minor recovery rally in mid-June offering relief to the coin holders from the recent sell-off in the crypto market. From the local support of $25200, the prices surged 5% to reach the current price of $26473. However, the daily candles started to project higher price rejection suggesting the broader market sentiment is still bearish. Can buyers turn the tables with the current recovery or will the seller continue to have the upper hand?
Also Read: Bitcoin Price Bulls Take Charge: Is a $42,000 Breakout Imminent?
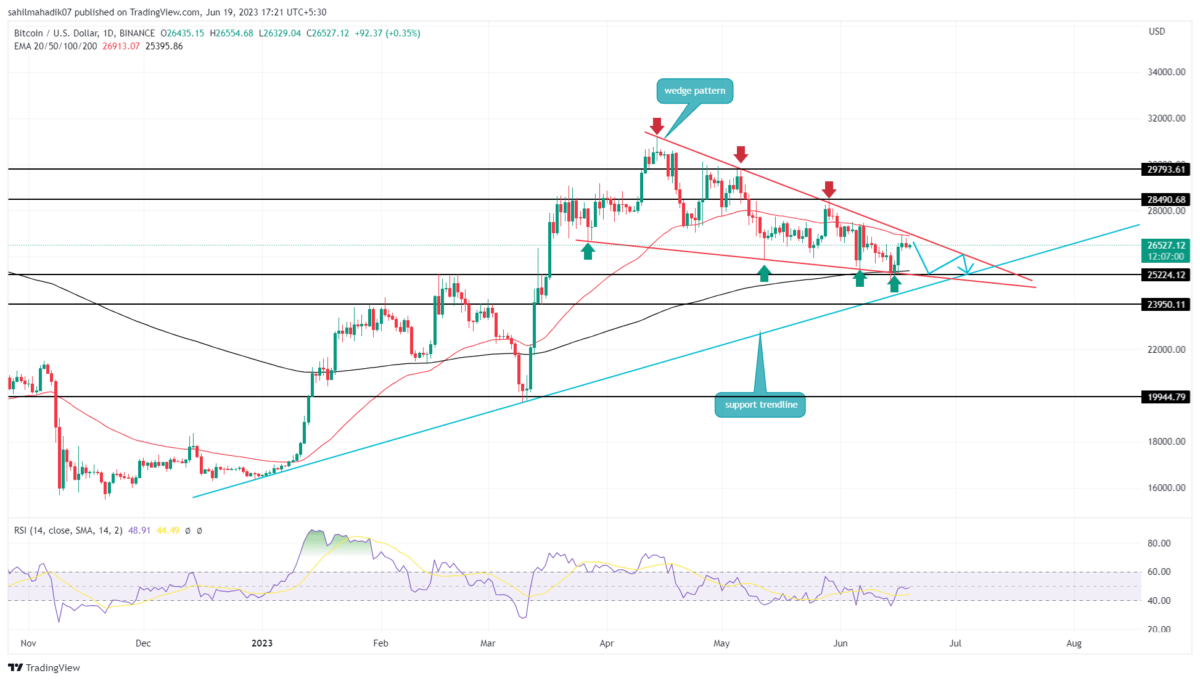
Bitcoin Price Daily Chart:
- The narrow area between the wedge pattern can be considered a no-trading zone
- The Bitcoin fear and greed index at 48% reflects neutral market sentiment.
- The intraday trading volume in Bitcoin is $9.12 billion, indicating a 38% loss.
Under the influence of a falling wedge pattern that governs the current retracement phase in Bitcoin price, the recent relief rally is likely a temporary growth. A bullish reversal from the pattern’s lower trendline triggers a new bull cycle which may push the prices back to the upper trendline.
As of now, the BTC price trades quite close to the overhead trendline, and there, the supply pressure is visible with the long-wick rejection candles. If the selling pressure persists for a few more trading traders, the coin price could trigger a bearish reversal.
This potential reversal will signal the continuation of the downward trend and lead the price back $25000.
Thus, the completion of this chart pattern is needed to free the Bitcoin price from the correction phase.
Will Bitcoin Price Rise to $27,000?
With the recent price surge, the BTC price is likely to hit the resistance trendline of the wedge pattern, trying to validate the overhead supply. The potential traders must remain still and watch the price behavior at this trendline to determine future prospects. A potential reversal from this barrier will prolong the current downfall, while an upside could pave the way for sustained recovery.
- Relative Strength Index: Contrary to the new lower low in price action, the RSI slope forming the same lows indicate the underlying bullish momentum in growing.
- Exponential Moving Average: The 50-and-200-day EMA creates a narrow range that may carry the possible consolidation phase in Bitcoin price.
Recent Posts
- Price Analysis
Why Bitcoin, Ethereum, XRP, and ADA Prices Are Falling Today
Over the past 24 hours, Bitcoin, Ethereum, XRP, and ADA prices dropped as the broader…
- Price Analysis
Is XRP Price Preparing for Trend Reversal as ETF Inflows Extend to a 7th Straight Week?
The XRP price is in a consolidation stage following months of continuous declining pressure. The…
- Price Analysis
Binance Coin Price Risks Crash to $700 as Key BSC Metric Plunges 80%
Binance Coin price dropped by over 1% today, Dec. 29, as the crypto market remained…
- Price Analysis
SUI Price Forecast: What’s Next for SUI in 2026 After $78.9M Token Unlocks?
SUI price has spent recent sessions consolidating within a narrow range. The action reflect controlled…
- Price Analysis
Solana Price Prediction: How High Could SOL Go in January 2026?
Solana price showed signs of strength in early January 2026, hovering near $127 after a…
- Price Analysis
Top 3 Predictions for Bitcoin price, Ethereum price and XRP price for 2026 According to Analysts
Bitcoin price, Ethereum price, and XRP price show renewed strength heading into 2026 after daily…