Bitcoin Price Analysis: Can $BTC Bulls Defend $26000 Support? Experts Predict “No”
Bitcoin price has extended its choppy behavior for over two weeks now, keeping the overall market sentiment uncertain. Any attempts from buyers or sellers are getting rejected and therefore, the BTC price has remained in a fixed range stretched from $27500 and $26684. It is better for new traders not to enter into such volatile price action and wait for a clear breakout.
Also Read: Bitcoin (BTC) Sell Side Risk Ratio At All-Time Low, Big Moves Ahead
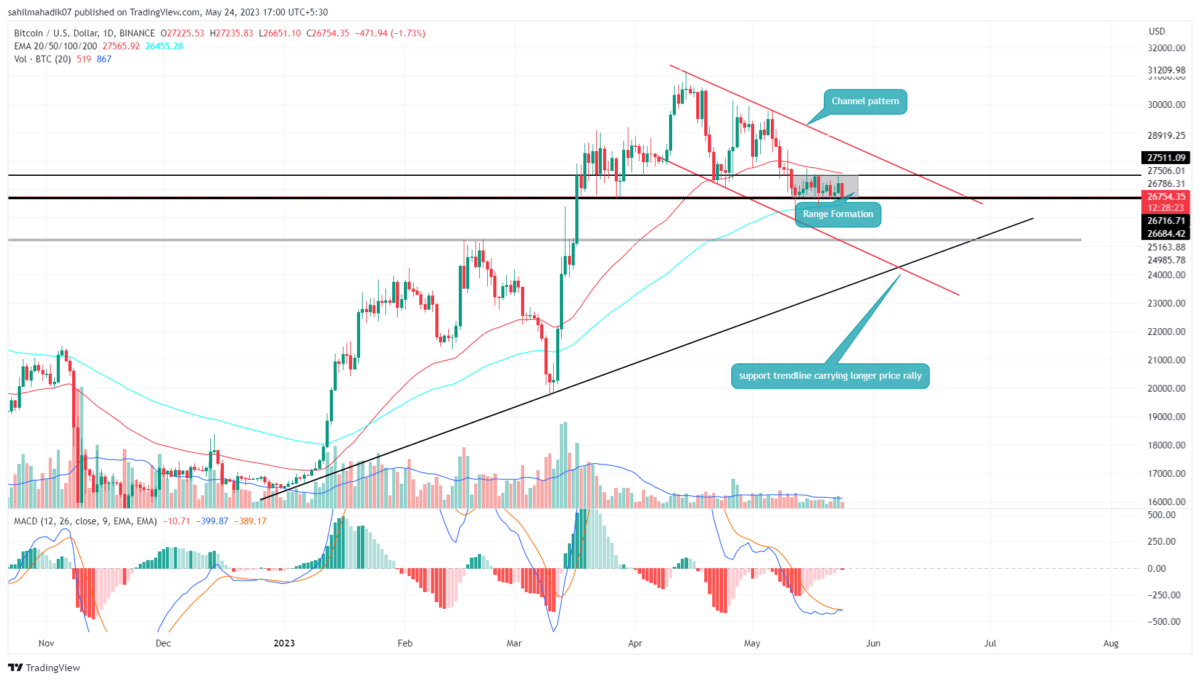
Bitcoin Price Daily Chart
- The range between $27500 and $26684 stands as a no-trading zone.
- A breakout from either side of the range may give suitable confirmation of a potential trend.
- The intraday trading volume in Bitcoin is $12.5 Billion, indicating a 10.4% loss.
BTC price witnessed a significant downtick today and registered a 1.7% intraday loss. The coin price currently exchanges hands at $26754 and showed a breakdown attempt from the aforementioned range support of $26684.
A breakdown below $26684 with daily candle closing would result in Bitcoin price sliding to the next significant support of $25265-$25171, registering a potential loss of 6%. However, the BTC price may remain bullish in the long term until the long-coming support trendline(black) is intact.
On a contrary note, a breakout above the range resistance of $27500 will trigger a short rally of around 3% to hit the overhead trendline near $28200.
Will Bitcoin Price Hold At $26000?
The Bitcoin price is actively taking support at the $26684 level preventing the sellers from extending the current correction phase to the lower levels. However, if the market sentiment shows no improvement a breakdown below the aforementioned will cause a sharp fall below $26000.
- Exponential Moving Average: The 50-day EMA slope moving close to the range resistance of $27500 and 100-day EMA $26684 support accentuates the importance of these chart levels.
- Moving Average Convergence Divergence: The MACD(Blue) and signal(orange) lines went flattish below the neutral line highlighting an indecisive price movement amid a longer downtrend.
Experts Predict Short Term Downfall For BTC Price
As Coingape reported, renowned trader Peter Brandt identified the ongoing consolidation in Bitcoin price as a famous bearish pattern called Flag/pennant.
Under the influence of this bearish setup, the coin price is likely to witness a significant downfall. The bearish thesis will get invalidated if the BTC price closes above the mid-swing top.
Recent Posts
- Price Analysis
How CLARITY Act Could Impact Bitcoin, Ethereum, and Dogecoin Prices?
The cryptocurrency market dropped 0.84% over the last 24 hours amid cautious trading, Fed uncertainty,…
- Price Analysis
Tesla Stock Price Prediction for Jan 2026 Ahead of Q4 Earnings Report
Tesla stock price has entered January 2026 consolidating after a sustained advance, with buyers defending…
- Price Analysis
Ethereum Price Eyes a 30% Surge as Vitalik Buterin Names it the ‘World’s Heartbeat’
Ethereum price dropped for the second consecutive day, mirroring the performance of other cryptocurrencies. The…
- Price Analysis
XRP Price Prediction After Spot XRP ETFs Record the First Outflow in 36 Days?
XRP price has entered a corrective phase after a strong rally failed to hold near…
- Price Analysis
XRP vs Solana Price: Which Could Outperform in January 2026?
XRP price and Solana price enter January 2026 from very different recovery structures despite both…
- Price Analysis
Meme Coin Price Prediction For Jan 2026: Dogecoin, Shiba Inu And Pepe Coin
The meme coin price trend saw a major shift last week as Dogecoin, Shiba Inu,…