
Bitcoin Price Analysis: Extends Consolidation Below $22,000; A Reversal Sign?


Bitcoin price analysis indicates extended sideways movement with a neutral bias. The market structure points at the accumulation near the lower levels.
- Bitcoin price continues to trend in a very range-bound manner.
- A retest of the $22,000 mark would a key in deciding the next upside run.
- However, a daily candle stick below $29,750 would be a bearish sign.
Bitcoin price consolidates
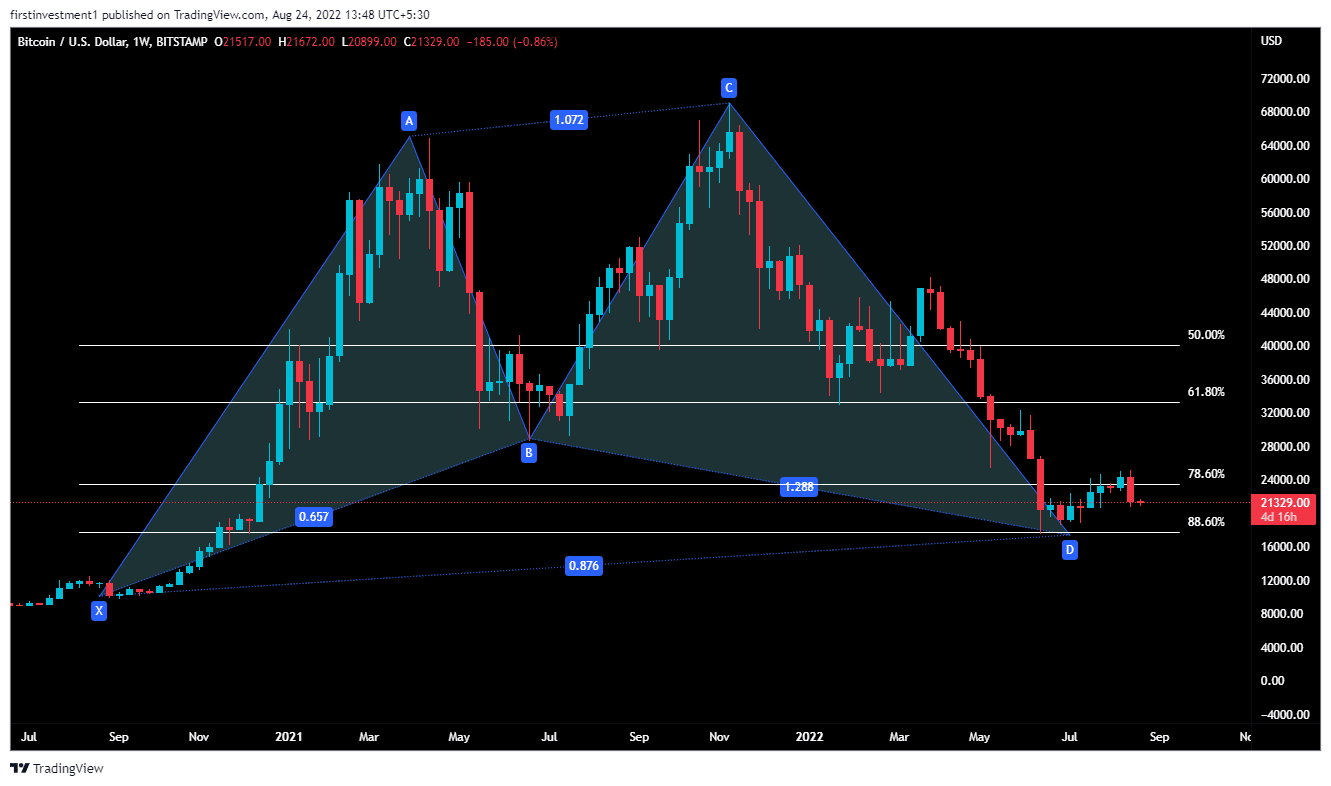
On the weekly chart, BTC formed a “Bullish Shark” harmonic pattern. In a bullish shark pattern, however, the second top is higher than the first one. In addition, it combines Fibonacci with Elliott’s waves theory, and some new ratios like 88.6% are used.
Further, the price hasn’t broken its previous swing low as well, indicating a possible reversal in the coming future.
According to this pattern, if the price closes above a strong bearish candle, tested the 88.6% Fib. level ($26,500), then we can expect a bullish movement of up to ($33,000).
The conclusion is that the price is still bearish, and has a possibility to go down even below recent swing low if the price isn’t able to close above the given level in the coming week. However, if the price doesn’t break ($20,750) this week, then we can expect a reversal in the coming weeks.
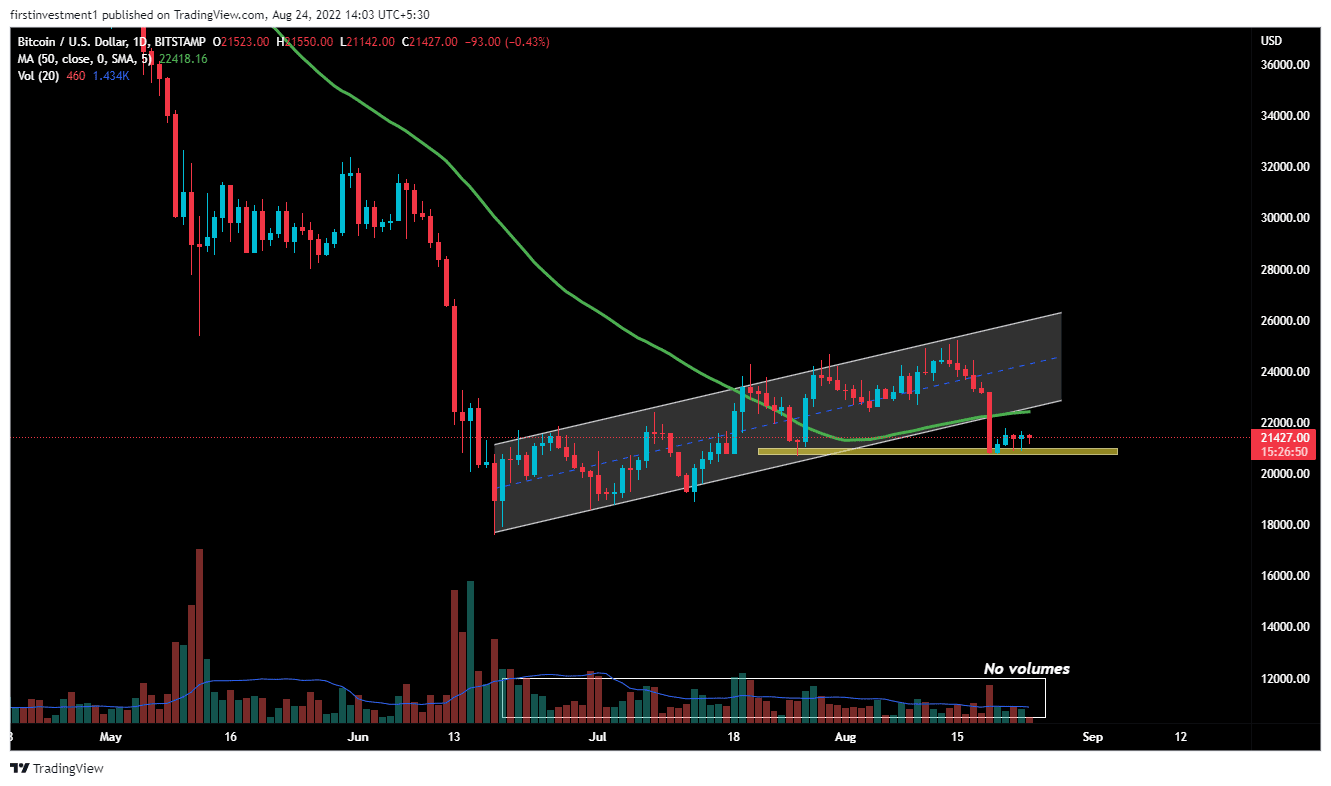
On the daily chart time-frame, the Bitcoin price analysis shows a beairsh trend.
The price traded in a bearish “Flag & Pole” pattern from June 15 to Aug 18.
Recently, BTC’s price broke the pattern’s support level and gave a bearish breakdown. Along with rising volumes. The price has taken good support at a swing low, and even consolidating, implying an accumalation.
The volumes were declining in a channel, with the rising price , which implied a concern for the bulls. When the market is rising while volume is declining, big money is not the one buying, more likely slowly exiting positions.
According to this pattern, The expected fall in BTC price could be $20,000. Next, downside target could be $19,600.
In addition to that, the price broke the 50-day exponential moving average & is sustaining below that level. If the price is able to break its recent low ($20,750), then we can expect a sharp fall in the coming days.
The nearest support is $20,750, whereas the nearest resistance is at around $21,750. There is a higher probability of the price breaking its support on, lower levels.
But, if any chance price tends to come close to its resistance, and we’ve seen any rejection there, then we can sell there as well “Sell on rising” Opportunity.
On the other hand, a break above the $21,500 level could invalidate the bearish outlook. And the price can reclaim $22,000 followed by the August 19 at $23,206.
BTC is bearish on all time frames. Below $20,750 closing on the hourly time frame, we can put a trade on the sell side.

Why Trust CoinGape
CoinGape has covered the cryptocurrency industry since 2017, aiming to provide informative insights Read more…to our readers. Our journal analysts bring years of experience in market analysis and blockchain technology to ensure factual accuracy and balanced reporting. By following our Editorial Policy, our writers verify every source, fact-check each story, rely on reputable sources, and attribute quotes and media correctly. We also follow a rigorous Review Methodology when evaluating exchanges and tools. From emerging blockchain projects and coin launches to industry events and technical developments, we cover all facets of the digital asset space with unwavering commitment to timely, relevant information.