

Bitcoin Price Analysis: Is $BTC Price Poised for Further Correction?


Bitcoin Price Analysis: The crypto witnessed a significant buying press in the last few days which is likely associated with the macro economical event of the US debt ceiling deal. As a result, the Bitcoin price bounced back from the local support of $26000 and surged 9% to the hit overhead trendline of the channel pattern. However, the supply pressure at this resistance keeps the BTC prices under the threat of prolonged correction.
Also Read: Debt Ceiling Deal Blocks 30% Proposed Tax On Crypto Mining, Confirms Congressman
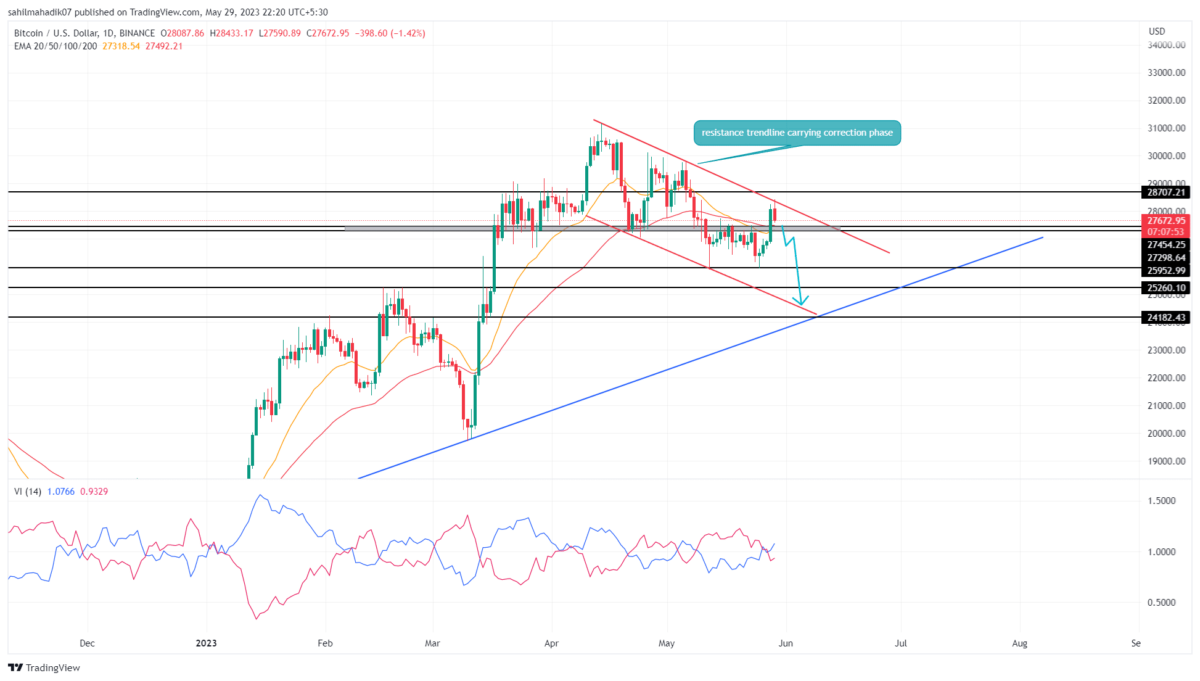
Bitcoin Price Daily Chart
- The current short-term trend in Bitcoin price is bearish, where it resonates between two converging trendlines of the channel pattern
- A red candle with long-wick rejection at the overhead trendline reflects a potential downfall in the BTC price
- The intraday trading volume in Bitcoin is $5.68 Billion, indicating a 12.5% loss.
 Source-Tradingview
Today, the Bitcoin price trades at $27762 with an intraday loss of 1.2%. This red candle is formed at the resistance trendline of the channel pattern indicating the sellers are still defending this resistance.
Usually, a reversal from the above trendline replenishes the selling momentum and sets the asset price to fall back to the lower trendline. For this potential downfall, a flip below the recently reclaimed $27500-$27200 will give an additional confirmation for the resumption of prevailing correction.
The post-breakdown may fall nearly 9% to hit the lower trendline of $25000.
Will Bitcoin Price Revist $25000?
In response to a reversal from the channel pattern’s resistance trendline, the Bitcoin price is poised for a downfall to the lower trendline which is currently situated at $25000. However, the potential fall may witness demand pressure at $27500 and $26000.
- Exponential Moving Average: The 20-and-50-day EMA accumulated near the $27500 created a strong support zone, and that could undermine potential correction with the channel pattern.
- Vortex Indicator: A bullish crossover between the VI+(blue) and VI-(orange) reflects the current market trend sentiment is positive.

Why Trust CoinGape
CoinGape has covered the cryptocurrency industry since 2017, aiming to provide informative insights Read more…to our readers. Our journal analysts bring years of experience in market analysis and blockchain technology to ensure factual accuracy and balanced reporting. By following our Editorial Policy, our writers verify every source, fact-check each story, rely on reputable sources, and attribute quotes and media correctly. We also follow a rigorous Review Methodology when evaluating exchanges and tools. From emerging blockchain projects and coin launches to industry events and technical developments, we cover all facets of the digital asset space with unwavering commitment to timely, relevant information.
Premium Partners


Related Articles


- Pi Network News: Pi Team Freezes All Payments Following Multi-Million Token Theft
- Trump Tariffs 2026: How Bitcoin, Ethereum, and Altcoins Could Be Affected
- US Risks Losing Digital Finance Edge: Coinbase Warns of China CBDC Advantage
- Is TRUMP Coin Officially Dead? Team Allegedly Cashes Out $94M USDC in Massive Sell-Off
- Arthur Hayes Snaps Up $4M in DeFi Tokens via Ethereum Sell-Off
- Top 3 Crypto Predictions Ahead of U.S. Government Shutdown Deadline in Jan 2026
- Grayscale Files for First U.S. Bittensor ETF: Will TAO Price Rally to $300 in January?
- Shiba Inu Price Prediction: Will SHIB Show Golden Cross Signal in 2026?
- Pi Network Price Prediction as Demand Slips Ahead of the 136m Unlock
- Why Bitcoin, Ethereum, XRP, and ADA Prices Are Falling Today
- Is XRP Price Preparing for Trend Reversal as ETF Inflows Extend to a 7th Straight Week?


