Bitcoin Price Analysis: Will $BTC Price Sustain $25000 Under Current Market Sell-off?


Bitcoin Price Analysis: On June 11th, the crypto market witnessed a sharp sell-off and tumbled several cryptocurrencies to lower price analysis. Earlier today, the leading cryptocurrency Bitcoin showcased a nearly 3% fall, but by the press time, it’s down 1.79% red. This rejection of the lower price indicates the buyers are defending this coin which keeps the upside potential intact.
Also Read: Crypto Selloff By Trading Firm Likely Behind Altcoin Crash
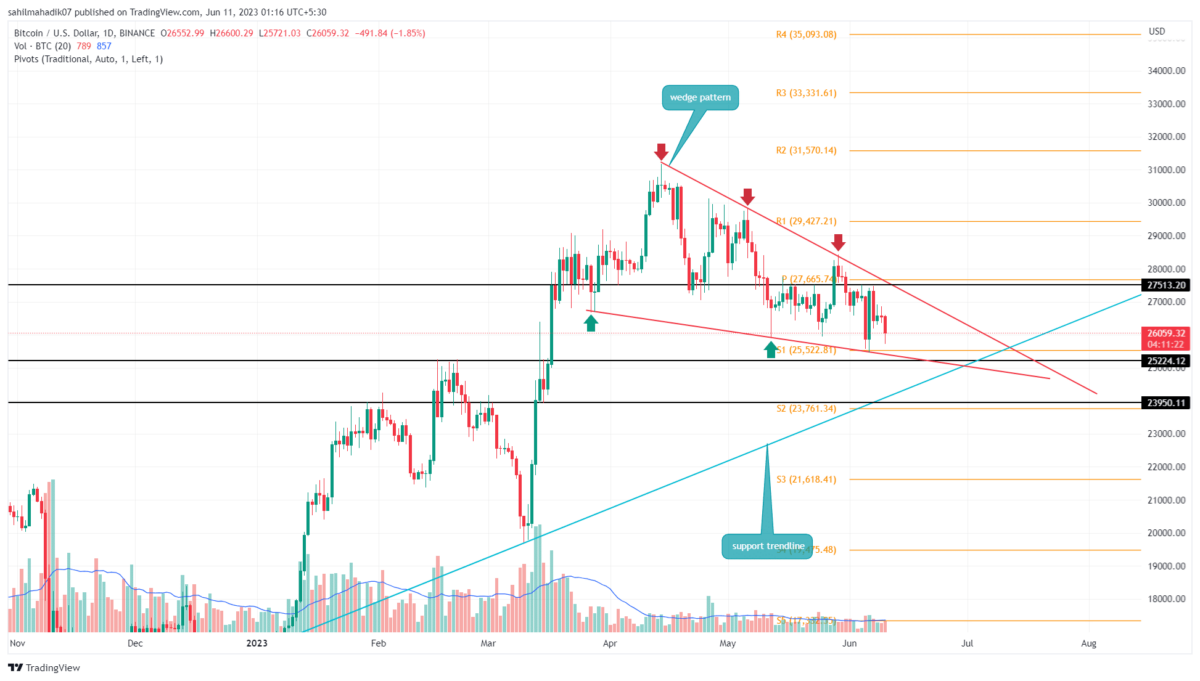
Bitcoin Price Daily Chart
- The Bitcoin price may witness high volatility resonating between the converging trendline of the wedge pattern
- A breakout above the overhead resistance trendline will signal a continuation of the prior recovery rally
- The intraday trading volume in Bitcoin is $12.2 Billion, indicating a 22% loss.
 Source-Tradingview
By the press time, the Bitcoin price trades at $26080 and continues to wobble between the two converging trendlines of falling wedge patterns. Despite the recent market sell-off on June 5th and June 10th, the coin price managed to sustain above the lower trendline reflecting the strong accumulation level for buyers.
In theory, the falling wedge pattern is a sign of a gradual decrease in selling pressure which leads to a massive bullish upswing. As for now, the converging trendline is narrowed enough to project a no-trading zone.
Thus, with the increased negativity in the crypto market, the BTC price may prolong a sideways trend for a few more sessions before an actual breakout.
A potential breakout will offer traders a long entry opportunity with a potential target of $31170.
Will Bitcoin Price Lose $25000?
The support trendline of the wedge pattern has remained strong despite a highly volatile market scenario. The coin buyers use this support to prevent massive downfall and recuperate the bullish momentum. Therefore, the BTC is likely to plunge below $25000 until this trend is intact.
- Moving Average Convergence Divergence: A bearish alignment between the MACD(blue) and signal(orange) accentuates a steady downtrend in Bitcoin price.
- Pivot levels: The daily chart shows the overhead resistances at $27680 and $29500 and important support at $25500 and $23750.

Why Trust CoinGape
CoinGape has covered the cryptocurrency industry since 2017, aiming to provide informative insights Read more…to our readers. Our journal analysts bring years of experience in market analysis and blockchain technology to ensure factual accuracy and balanced reporting. By following our Editorial Policy, our writers verify every source, fact-check each story, rely on reputable sources, and attribute quotes and media correctly. We also follow a rigorous Review Methodology when evaluating exchanges and tools. From emerging blockchain projects and coin launches to industry events and technical developments, we cover all facets of the digital asset space with unwavering commitment to timely, relevant information.
Related Articles


- Crypto News: Strategy Bitcoin Underwater After 30% BTC Crash
- Expert Predicts Ethereum Crash Below $2K as Tom Lee’s BitMine ETH Unrealized Loss Hits $6B
- Bitcoin Falls Below $80K as Crypto Market Sees $2.5 Billion In Liquidations
- Top Reasons Why XRP Price Is Dropping Today
- Will Bitcoin Price Crash in 2026 as Market Volatility Rises?
- Here’s Why MSTR Stock Price Could Explode in February 2026
- Bitcoin and XRP Price Prediction After U.S. Government Shuts Down
- Ethereum Price Prediction As Vitalik Withdraws ETH Worth $44M- Is a Crash to $2k ahead?
- Bitcoin Price Prediction as Trump Names Kevin Warsh as new Fed Reserve Chair
- XRP Price Outlook Ahead of Possible Government Shutdown
- Ethereum and XRP Price Prediction as Odds of Trump Attack on Iran Rise


