Bitcoin Price Analysis: Will $BTC Surpass $27500 Before Weekend?


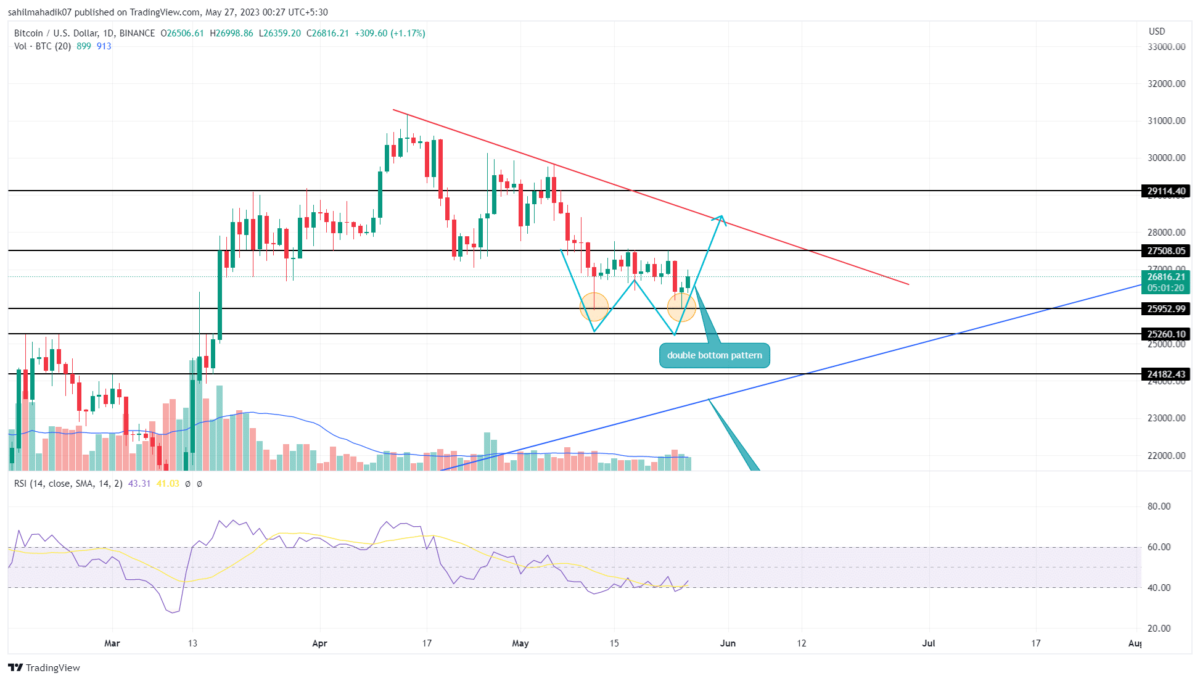
In the midst of two-weeks consolidation, the Bitcoin price bounced back twice the local support of $26000. Using this psychological level as a base, the daily chart shows a double-bottom pattern formation. This chart pattern is known to accumulate buying pressure at lower support and triggers a bullish reversal. Thus this pattern could assist the BTC price in escaping the market’s current volatile phase.
Also Read: Bitcoin Core’s Latest Update Promises Major Performance Boost, BTC Price To Rally?
Bitcoin Price Daily Chart
- A potential breakout from the $27500 neckline resistance of the double bottom pattern may encourage a bullish recovery in the BTC price
- The midline of the Bollinger band indicator acts as active resistance trying to restrict bullish growth.
- The intraday trading volume in Bitcoin is $5.68 Billion, indicating a 12.5% loss.
 Source-Tradingview
In the daily time frame chart, the Bitcoin price shows a formation of a bullish reversal candle morning star $26000 support. This reversal will fuel the development of the aforementioned double-bottom pattern and push the prices to immediate resistance of $27500.
A breakout above the neckline resistance will be crucial to complete the chart pattern as it boasts the buying momentum in this coin. If the daily candle closes above $27500, the buyers will obtain a suitable springboard to climb higher levels.
This development will encourage buyers to attempt a strong breakout at the long-coming resistance trendline. This dynamics resistance is the key gateway for resuming the prevailing recovery in Bitcoin.
Will Bitcoin Price Surpass $27500?
At the time of writing Bitcoin price is up by small 0.8% over last 24 hrs and is currently $26, 686. Under the influence of the double bottom pattern, the Bitcoin price is likely to witness a bullish upswing in the daily chart. This reversal is bound to breach the $27500 neckline resistance and resolve the current indecisiveness sentiment in the market.
- Bollinger Band: An uptick in the lower band of the BB indicator offers additional support for a bullish reversal.
- Vortex indicator: A higher low formation in the daily RSI slope accentuates the active accumulating from buyers at $26000.

Why Trust CoinGape
CoinGape has covered the cryptocurrency industry since 2017, aiming to provide informative insights Read more…to our readers. Our journal analysts bring years of experience in market analysis and blockchain technology to ensure factual accuracy and balanced reporting. By following our Editorial Policy, our writers verify every source, fact-check each story, rely on reputable sources, and attribute quotes and media correctly. We also follow a rigorous Review Methodology when evaluating exchanges and tools. From emerging blockchain projects and coin launches to industry events and technical developments, we cover all facets of the digital asset space with unwavering commitment to timely, relevant information.
Related Articles


- India’s Crypto Taxation Unchanged as the Existing 30% Tax Retains
- Crypto News: Strategy Bitcoin Underwater After 30% BTC Crash
- Expert Predicts Ethereum Crash Below $2K as Tom Lee’s BitMine ETH Unrealized Loss Hits $6B
- Bitcoin Falls Below $80K as Crypto Market Sees $2.5 Billion In Liquidations
- Top Reasons Why XRP Price Is Dropping Today
- Here’s Why MSTR Stock Price Could Explode in February 2026
- Bitcoin and XRP Price Prediction After U.S. Government Shuts Down
- Ethereum Price Prediction As Vitalik Withdraws ETH Worth $44M- Is a Crash to $2k ahead?
- Bitcoin Price Prediction as Trump Names Kevin Warsh as new Fed Reserve Chair
- XRP Price Outlook Ahead of Possible Government Shutdown
- Ethereum and XRP Price Prediction as Odds of Trump Attack on Iran Rise


