Bitcoin Price Analysis: Will $BTC Surpass $27500 Before Weekend?
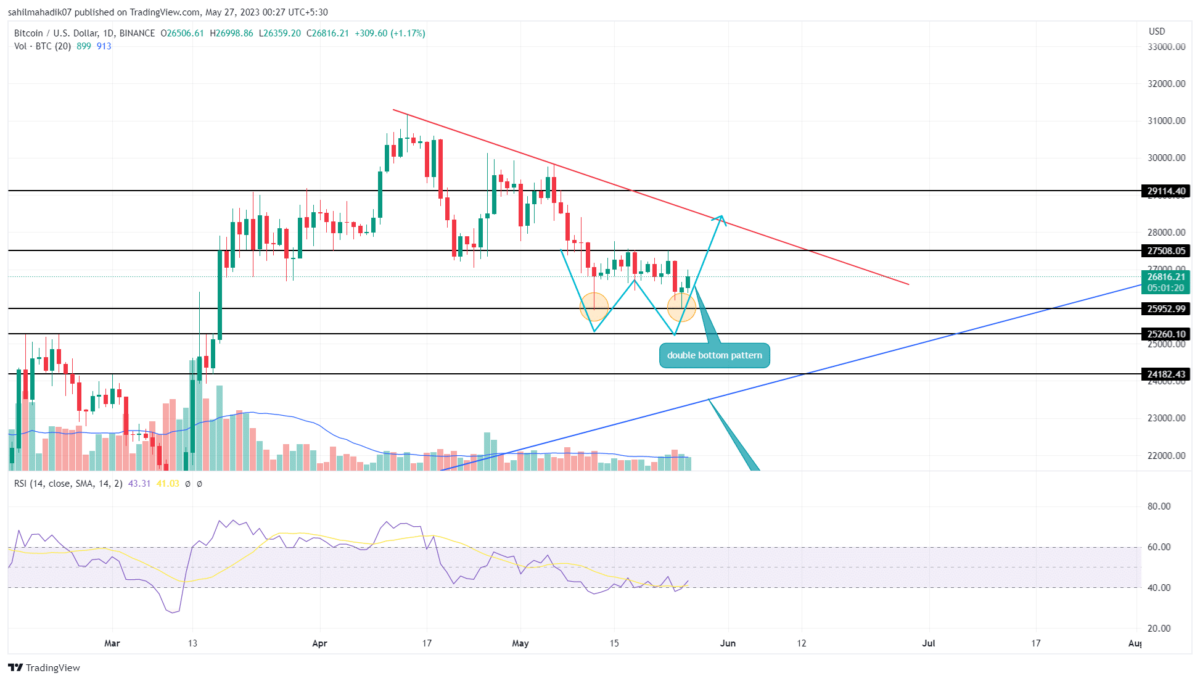
In the midst of two-weeks consolidation, the Bitcoin price bounced back twice the local support of $26000. Using this psychological level as a base, the daily chart shows a double-bottom pattern formation. This chart pattern is known to accumulate buying pressure at lower support and triggers a bullish reversal. Thus this pattern could assist the BTC price in escaping the market’s current volatile phase.
Also Read: Bitcoin Core’s Latest Update Promises Major Performance Boost, BTC Price To Rally?
Bitcoin Price Daily Chart
- A potential breakout from the $27500 neckline resistance of the double bottom pattern may encourage a bullish recovery in the BTC price
- The midline of the Bollinger band indicator acts as active resistance trying to restrict bullish growth.
- The intraday trading volume in Bitcoin is $5.68 Billion, indicating a 12.5% loss.
In the daily time frame chart, the Bitcoin price shows a formation of a bullish reversal candle morning star $26000 support. This reversal will fuel the development of the aforementioned double-bottom pattern and push the prices to immediate resistance of $27500.
A breakout above the neckline resistance will be crucial to complete the chart pattern as it boasts the buying momentum in this coin. If the daily candle closes above $27500, the buyers will obtain a suitable springboard to climb higher levels.
This development will encourage buyers to attempt a strong breakout at the long-coming resistance trendline. This dynamics resistance is the key gateway for resuming the prevailing recovery in Bitcoin.
Will Bitcoin Price Surpass $27500?
At the time of writing Bitcoin price is up by small 0.8% over last 24 hrs and is currently $26, 686. Under the influence of the double bottom pattern, the Bitcoin price is likely to witness a bullish upswing in the daily chart. This reversal is bound to breach the $27500 neckline resistance and resolve the current indecisiveness sentiment in the market.
- Bollinger Band: An uptick in the lower band of the BB indicator offers additional support for a bullish reversal.
- Vortex indicator: A higher low formation in the daily RSI slope accentuates the active accumulating from buyers at $26000.
Recent Posts
- Price Analysis
XRP, Bitcoin, Ethereum Price Predictions Ahead of Jan 2026 CLARITY Act and US Crypto Reserve Plans
The XRP, Bitcoin, and Ethereum prices remained in a bear market after falling by over…
- Price Analysis
Pi Network Analysis: Pi Coin Price Surges on Christmas Eve, Can It Hit Year-End Highs?
Pi coin price reflect cautious positioning as market structure tightens near a key base. The…
- Price Analysis
Why Dec 26th Is A Do Or Die for Bitcoin Price Ahead Of Record Options Expiry?
As Christmas winds down, the Bitcoin price dipped 0.74% to around $86,750. Market participants…
- Price Analysis
Why Bitcoin, Ethereum And XRP Prices Are Down Today? (24 Dec)
The crypto market extended losses ahead of Christmas as Bitcoin, Ethereum, and XRP slipped further…
- Price Analysis
XRP Price Prediction: Will 4 Billion Transactions Spark Next Rally?
XRP price trades below the $2 mark after the latest correction across the broader cryptocurrency…
- Price Analysis
Solana Price Outlook: Will SOL Recover With Strong Institutional Buying?
Solana price remains steady above the $120 support after the recent crypto market pullback. The…