
Bitcoin Price Crash Likely as Bollinger Band Creator Signals End of Rally Phase


Highlights
- A bearish pattern identified by John Bollinger on the BTC/USD chart could signal the "end of rally phase" for Bitcoin price.
- Bitcoin's 30-day implied volatility has hit an 11-month low, indicating reduced expectations for significant price swings.
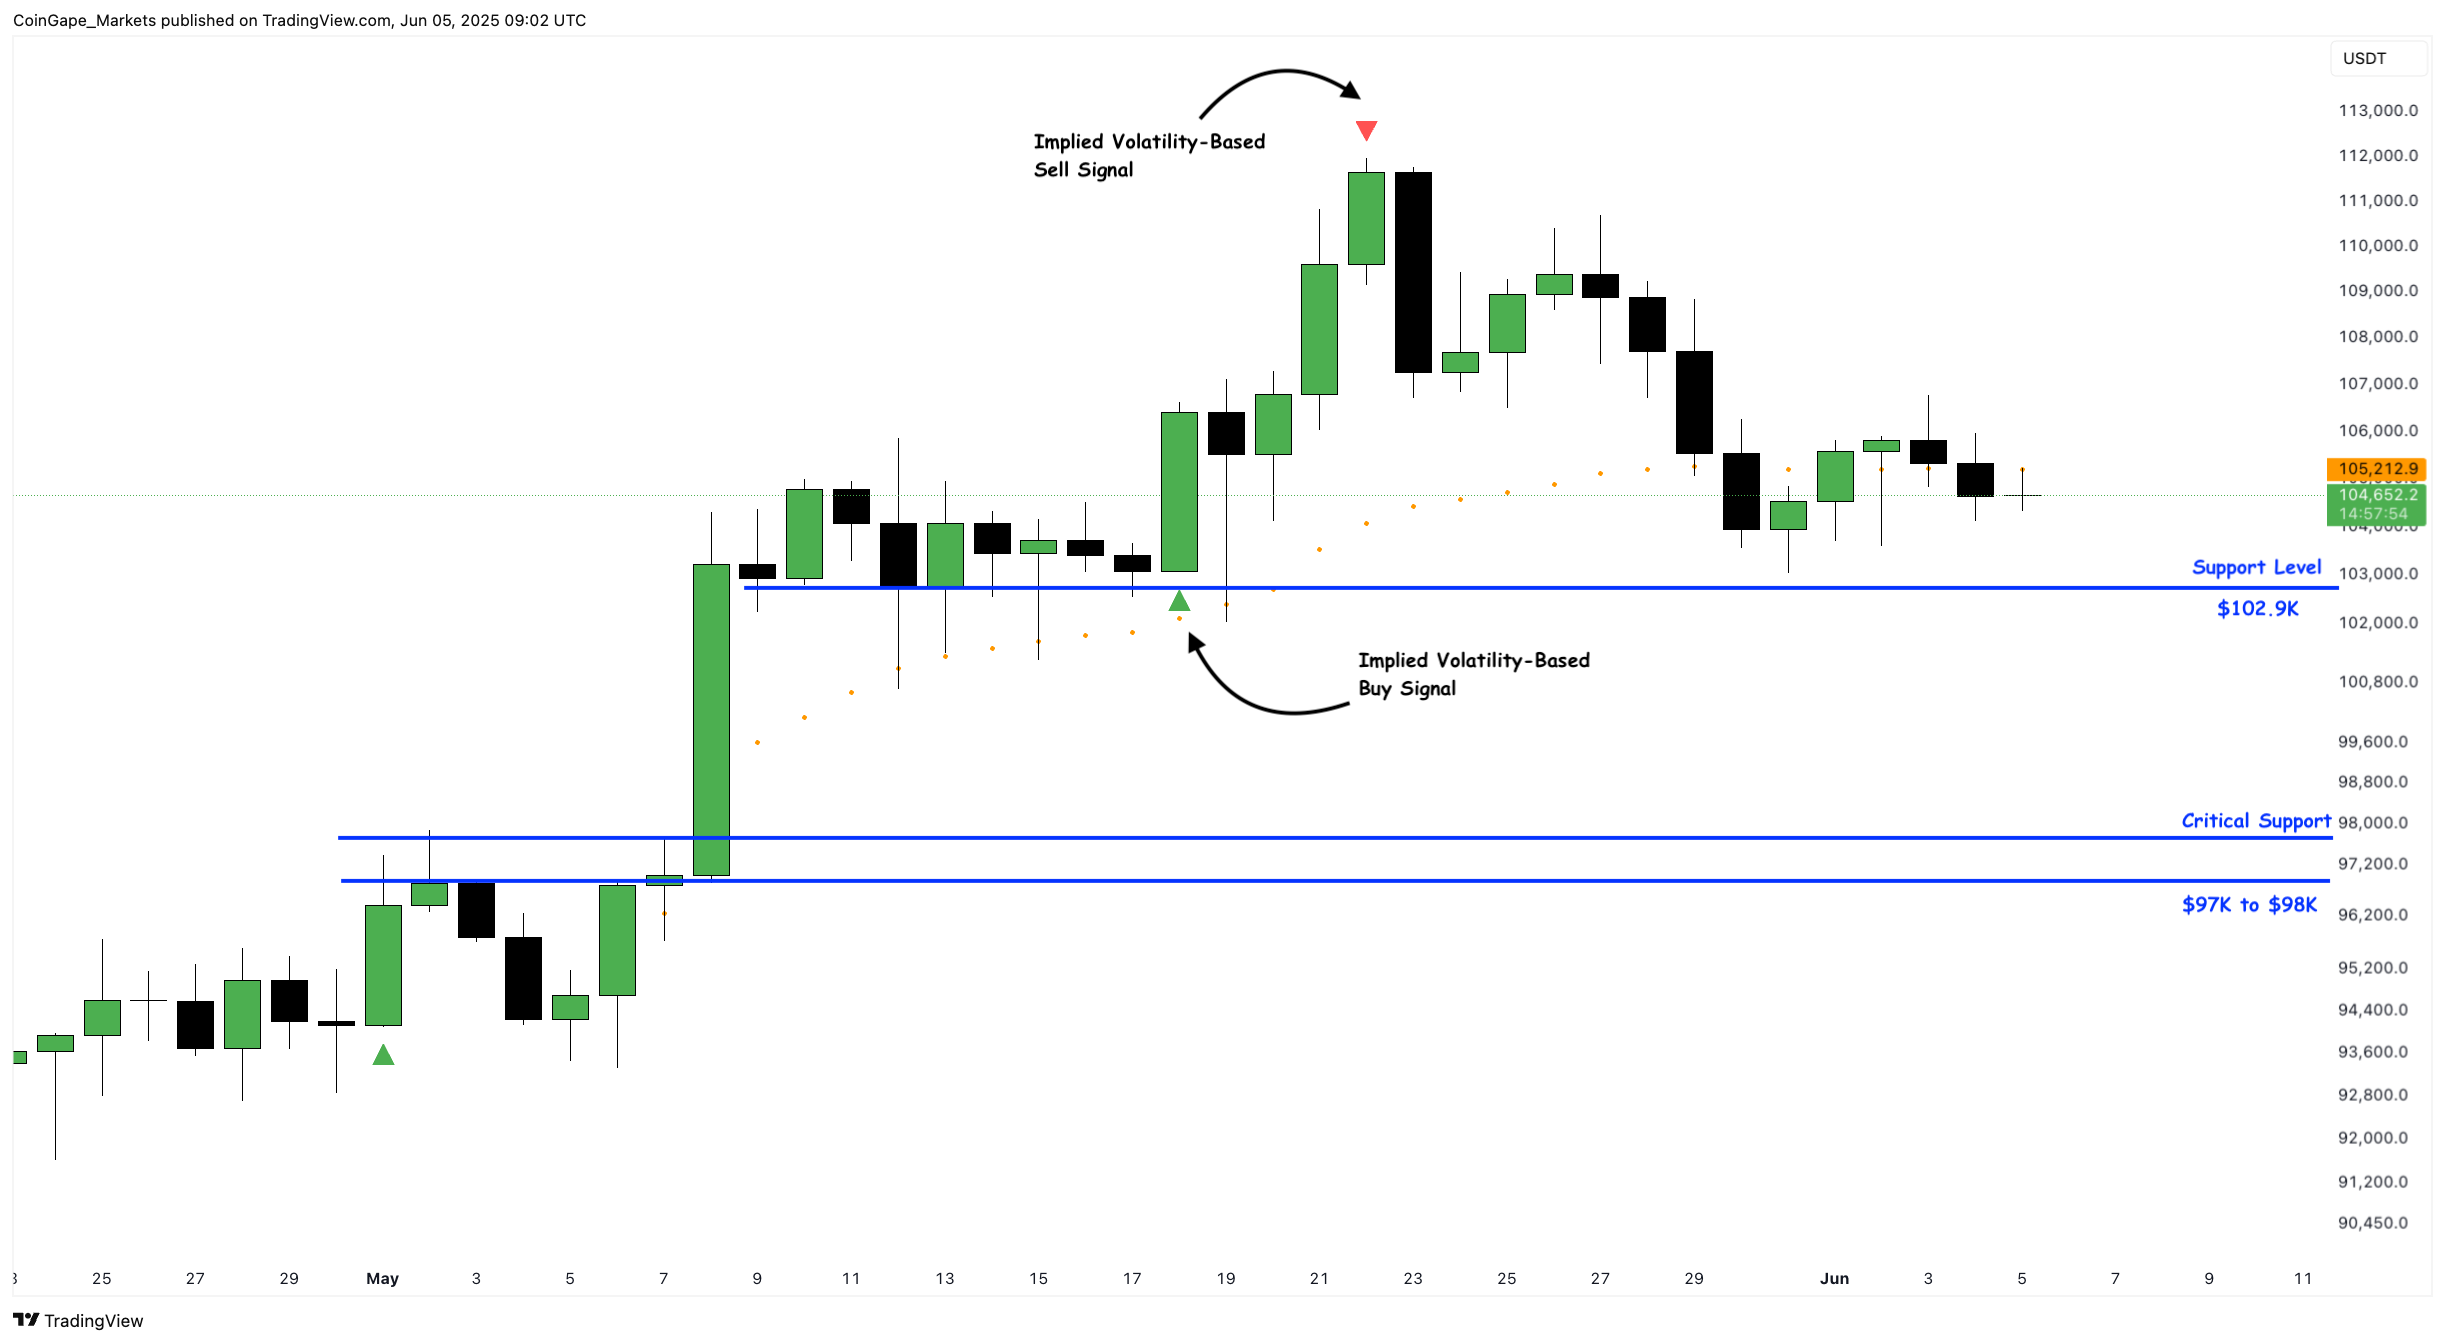
- A breakdown of the $102.9K support level could trigger a 4-6% crash to the $97K-$98K support zone.
Is a Bitcoin price crash brewing? As of June 4, 2025, investors could be bracing for a potential downturn as key sell signals emerge. Bollinger Bands creator John Bollinger identified a bearish pattern on the BTC/USD chart that could hint at the “end of rally phase” for BTC price. To make matters worse, Bitcoin’s collapsing 30-day implied volatility (IV), CME futures and options open interest warn confidence among sophisticated investors, raising concerns about a potential Bitcoin price correction.
Bollinger Bands Point to a Bearish Shift
John Bollinger, the renowned technical analyst behind Bollinger Bands, flagged a critical pattern in his Bitcoin price analysis posted to Twitter on June 4. He noted a “Three Pushes to a High” formation on the BTC/USD daily chart, where BTC price hit the upper Bollinger Band three times. This pattern typically signals the “end of rally phase”, indicating that Bitcoin’s bullish momentum may be fading. Repeated touches of the upper band often suggest overbought conditions. Failed breakout attempts further highlight the lack of buying pressure.
A picture perfect 'Three Pushes to a High' Bollinger Band Pattern marked the end of this rally phase for $BTCUSD. https://t.co/KZ3GWr7a2o
— John Bollinger (@bbands) June 4, 2025
Since May 23, Bitcoin price has crashed 6.54% and is currently sitting above $104K support. If momentum weakens, traders can expect a retest of $102,420, which is the lower Bollinger Band. A breakdown of this level suggests a shift in sentiment favoring bears. Hence, investors must exercise caution as noted by Bollinger’s bearish Bitcoin price prediction for June 2025.
Implied Volatility Crash Signals Reduced Activity
Bitcoin’s price faces further headwinds in terms of declining 30-day implied volatility (IV) hitting an 11-month low as of June 3, 2025. This drop in IV signals reduced expectations for significant price swings. Coupled with muted CME futures and options interests, the outlook for BTC remains uncertain, with sophisticated traders playing it safe.
- CME futures open interest dropped from $17.51 billion to $15.69 billion between May 29 and June 3, 2025.
- CME options open interest fell from $4.74 billion to $3.04 billion.
- The annualized basis also declined from 9.18% on May 2 to 6.29% on June 2, 2025.
A lower basis indicates reduced profitability for holding futures compared to spot Bitcoin, often a sign that sophisticated investors are scaling back. This could be driven by uncertainty around macroeconomic policies or a recent shift in institutional interest toward Ethereum (ETH). BlackRock’s recent ETH purchase after selling BTC holdings is the best example.
Additionally, Abraxas Capital withdrew 13,771 ETH worth $36.4M and the current price of $2,500 from Binance over the past 12 hours. With other whales also transferring ETH to cold wallets. This pivot also explains the recent drop in IV and the potential Bitcoin crash outlook as well.
Bitcoin Price Analysis: Key Levels to Watch
The daily Bitcoin price chart shows three lower highs formed since the ATH at $112K. A breakdown of the $102.9K support level will flip the high-timeframe market structure bearish. Such a development could trigger a crash to $101K or the $100K psychological level.
A look at the four-hour BTCUSD chart shows a string of higher highs and higher lows since the May 31 swing low of $103,032.
Currently, the BTC price trades at $104,629 after bouncing from the $104,274 support level. If the bullish market structure retains, investors can expect a short-term bounce to the next key hurdle at $107,782.

A breakdown of the $102.9K support level could catalyze a 4% to 6% crash to the $97K to $98K support zone. This area is critical as it could attract a lot of sidelined buyers to purchase BTC below $100K.
For a long-term price prediction of Bitcoin for 2025: Read This
Conclusion
The Bitcoin price is at a crossroads, with John Bollinger’s ‘end of rally phase’ signal, a sharp implied volatility crash, and reduced CME futures activity pointing to a potential Bitcoin price crash in June 2025. Traders should focus on key support and resistance levels while maintaining disciplined risk management. Although a bullish reversal remains possible, the current technical and market signals suggest a bearish tilt, urging caution in the crypto market.
Play 10,000+ Casino Games at BC Game with Ease
- Instant Deposits And Withdrawals
- Crypto Casino And Sports Betting
- Exclusive Bonuses And Rewards

Frequently Asked Questions (FAQs)
1. What is the "Three Pushes to a High" formation?
2. What does the decline in implied volatility indicate?
3. What are the key levels to watch for Bitcoin price?

Why Trust CoinGape
CoinGape has covered the cryptocurrency industry since 2017, aiming to provide informative insights Read more…to our readers. Our journal analysts bring years of experience in market analysis and blockchain technology to ensure factual accuracy and balanced reporting. By following our Editorial Policy, our writers verify every source, fact-check each story, rely on reputable sources, and attribute quotes and media correctly. We also follow a rigorous Review Methodology when evaluating exchanges and tools. From emerging blockchain projects and coin launches to industry events and technical developments, we cover all facets of the digital asset space with unwavering commitment to timely, relevant information.
24 Hours volume
$21.69B
Market Cap
$1.38T
Max Supply
21M


- US-Iran Tensions Spike as Trump Sets 48-Hour Deadline on Strait of Hormuz Blockade
- Breaking: U.S. Prepares for Potential Peace Talks in Iran War as Trump Mulls ‘Winding Down’ Military Efforts
- Crypto Market Recovers as Expert Warns U.S. Easing of Iran Sanctions Won’t Stabilize Oil Prices
- CLARITY Act May Still Delay Despite Stablecoin Yield Deal, Galaxy’s Alex Thorn Warns
- MSTR, COIN, HOOD Stock Prices Crash As FED Rate Hike Odds Climb to 50% in 2026
- XRP Price Prediction Ahead of March 27 SEC Spot ETF Decision
- Will Solana Price Explode This Week Amid New SEC/CFTC Crypto Rules?
- Ethereum, XRP, and Solana Price Prediction As CLARITY Act Advances After Senate–White House Deal
- Why is Pi Network Price Up Today (March 21) Despite Market Wide Correction?
- Bittensor (TAO) Price Surges 20% After Nvidia CEO Comments
- Dogecoin, Shiba Inu, and Pepe Coin Price Prediction If BTC Holds $70k Level


