Bitcoin Price Eyes $50k Mark Following Strategic Market Retracement
The initial enthusiasm for the spot Bitcoin ETF has given way to market uncertainty, as BTC’s performance lags behind the broader cryptocurrency market. Following its U.S. market debut, the Bitcoin price briefly soared to $49,000, only to undergo a swift retracement to $42,000, culminating in a 12% loss within just three days.
In the midst of this downturn, Blackrock, a leading asset management firm, made a significant move by acquiring 11,500 BTC. This action by Blackrock has ignited a sense of optimism among investors, viewing the dip as a potential buying opportunity. The key question that emerges is whether this market dip represents a strategic investment moment
Is Bitcoin Price Ready for $50000?
- Bitcoin Fear & Greed Index at 60% reflects the market sentiment remains bullish on this asset
- The 50-day EMA slope wavering at $42000 provides additional support to crypto buyers.
- The intraday trading volume in Bitcoin is $13.6 Billion, indicating a 61% loss.
Over the past four months, the leading cryptocurrency Bitcoin has experienced a significant rally, primarily driven by widespread enthusiasm among investors regarding the anticipated approval of a Spot Bitcoin ETF. This surge in investor confidence has propelled the BTC from a low of $24,962 to a two-year high of $49,000, marking an impressive 96.3% growth.
On January 11th, the Bitcoin Hash Rate reached an all-time high of 630.91m TH/s. This milestone means the network is now making over 600 quintillion calculations per second to solve the complex puzzles in block mining. The rising Hast Rate and upcoming halving event can lead to a decreased supply of new Bitcoins on the market if miners find it less profitable to mine, potentially putting upward pressure on the price.
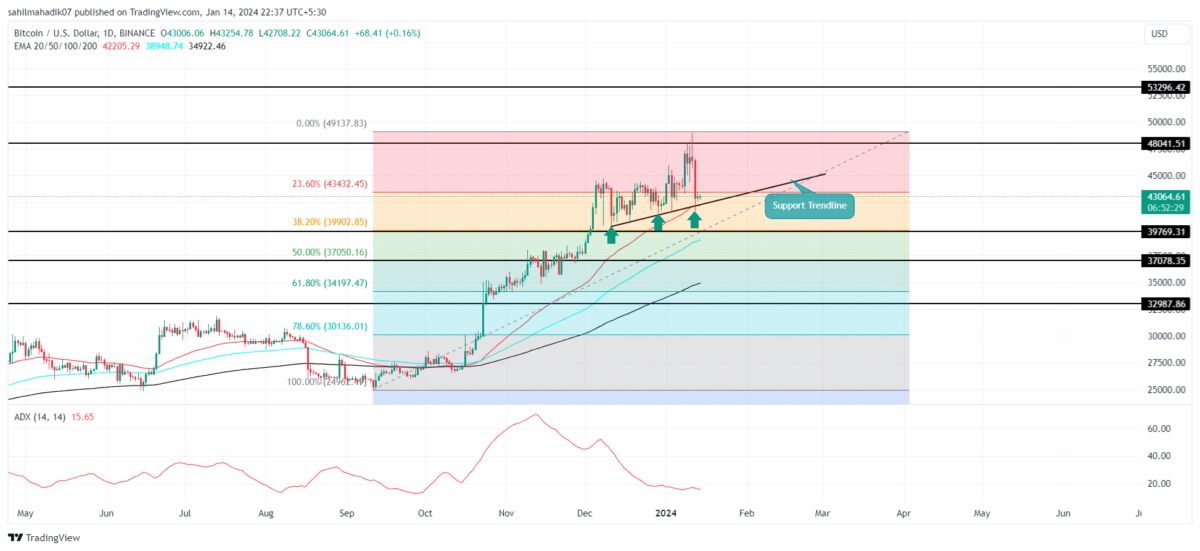
Despite the positive developments and market sentiment surrounding Bitcoin, the BTC price recently struggled to maintain momentum, reversing from the $49,000 mark. This pullback brought the cryptocurrency down to a critical support zone, marked by the 23.6% Fibonacci retracement level and an ascending trendline.
If Bitcoin manages to hold steady at this level, there’s potential for buyers to initiate a robust rebound, potentially driving the price above the swing high resistance of $48,000. Such a breakout could provide a solid foundation for the buyers to extend the recovery rally, aiming first for $53,300, and then possibly reaching as high as $60,000.
Key Level to Focus in Current Correction
Analyzing the daily time frame chart reveals that an ascending trendline has been crucial in offering dynamic support to Bitcoin, aiding in its steady recovery. The coin price has rebounded several times from this support level, indicating that buyers are actively accumulating during market dips. This trend suggests a strong buying interest at lower price levels.
However, if Bitcoin loses this critical support during the current correction, it could trigger an extended decline towards $39,500 or $37,000, which aligns with the 38.2% and 50% Fibonacci retracement levels, respectively.
Any further downfall could start to reflect a weakening in buyer conviction, signaling a potential shift in market sentiment
- Exponential Moving Average: The coin price above 50-and-200-day EMA indicates the overall trend is strongly bullish
- Average Directional Index: The low ADX value of 15% reflects current uncertainty in the market and has provided buyers sufficient to recover their strength.
Related Articles:
- Bitcoin (BTC) Price to Touch $1M in Days to Weeks – Samson Mow
- Michael Saylor Delivers Crucial Warning Amid Spot Bitcoin ETF Debut
- What’s Next After Spot Bitcoin ETF? Expert Unveils Key Trends to Watch
Recent Posts
- Price Analysis
Will Solana Price Hit $150 as Mangocueticals Partners With Cube Group on $100M SOL Treasury?
Solana price remains a focal point as it responds to both institutional alignment and shifting…
- Price Analysis
SUI Price Forecast After Bitwise Filed for SUI ETF With U.S. SEC – Is $3 Next?
SUI price remains positioned at a critical intersection of regulatory positioning and technical structure. Recent…
- Price Analysis
Bitcoin Price Alarming Pattern Points to a Dip to $80k as $2.7b Options Expires Today
Bitcoin price rebounded by 3% today, Dec. 19, reaching a high of $87,960. This rise…
- Price Analysis
Dogecoin Price Prediction Points to $0.20 Rebound as Coinbase Launches Regulated DOGE Futures
Dogecoin price has gone back to the spotlight as it responds to the growing derivatives…
- Price Analysis
Pi Coin Price Prediction as Expert Warns Bitcoin May Hit $70k After BoJ Rate Hike
Pi Coin price rose by 1.05% today, Dec. 18, mirroring the performance of Bitcoin and…
- Price Analysis
Cardano Price Outlook: Will the NIGHT Token Demand Surge Trigger a Rebound?
Cardano price has entered a decisive phase as NIGHT token liquidity rotation intersects with structural…