Bitcoin Price Is Preparing Its Next Move Within This Chart Pattern
The Bitcoin technical chart showcased a roller coaster ride as prices took a V-top reversal during Mid August and dumped back to 2022 bottom support of $18000. Moreover, over the last weeks, the crypto market suffered due to unfavorable news such as High CPI data, Fed interest hike, and the U.S. dollar index(DXY) rise to a 20-year high. As a result, the market participants’ fear of further downfall has increased.
Key points from Bitcoin price analysis:
- Bitcoin Fear & Greed Index has dropped to 24%, signaling extreme fear among market participants.
- Interested traders should wait for the Bitcoin price to breach the triangle pattern barriers before they position their funds.
- The intraday trading volume in Bitcoin is $22.6 Billion, indicating a 35% loss.
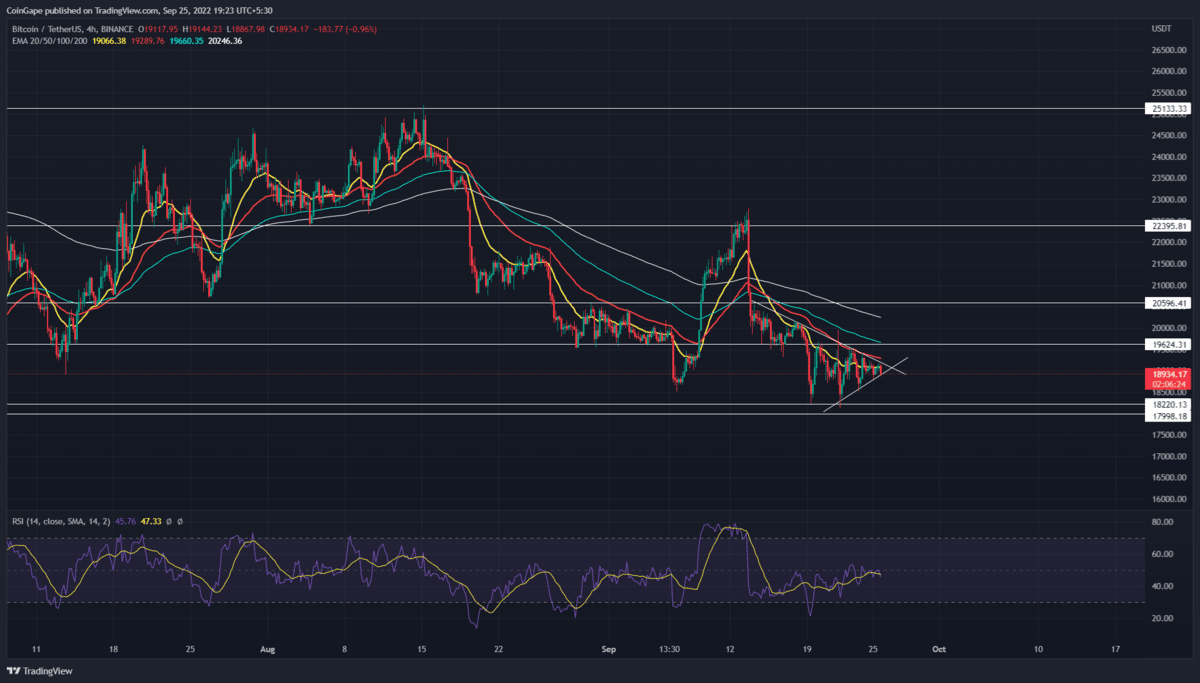
The Bitcoin retested the bottom support zone at $$18200-18000 on September 19th. However, even a week has nearly passed, the BTC price is still wavering around this support. This consolidation indicates uncertainty in market participants.
Anyhow, the 4-hour time frame chart reflects this consolidation as the formation of a symmetrical triangle pattern. In theory, this pattern usually resumes the prevailing trend after a short period of break; however, a breakout on the other side is quite possible.
Today, the Bitcoin price is trading at the $19062 mark and shows a 0.7 intraday gain. Furthermore, the two convergence trendlines have narrowed the prices enough to be considered a no-trading zone.
Therefore, a breakdown below the support trendline will intensify the ongoing bearish trend and plunge the Bitcoin price below the $18000 mark.
On a contrary note, a candle closing above the resistance trendline will signal an early sign of bullish reversal. As a result, the coin holders may witness another upswing.
Technical Indicator
RSI: Contrary to the sideways price action, the rising RSI slope indicates growth in underlying bullishness. Moreover, this positive divergence encourages a bullish breakout from the triangle pattern.
EMAs: the downsloping crucial EMAs(20, 50, 100, and 200) indicate any potential rally would face multiple resistance on its way up.
- Resistance level- $19600 and $20600
- Support level- $18000 and $16500
Recent Posts
- Price Analysis
Pi Coin Price Prediction as Expert Warns Bitcoin May Hit $70k After BoJ Rate Hike
Pi Coin price rose by 1.05% today, Dec. 18, mirroring the performance of Bitcoin and…
- Price Analysis
Cardano Price Outlook: Will the NIGHT Token Demand Surge Trigger a Rebound?
Cardano price has entered a decisive phase as NIGHT token liquidity rotation intersects with structural…
- Price Analysis
Will Bitcoin Price Crash to $74K as Japan Eyes Rate Hike on December 19?
Bitcoin price continues to weaken after breaking below its recent consolidation range, now trading within…
- Price Analysis
Bitwise Predicts Solana Price Will Hit New All-Time Highs in 2026
Solana price declined by 4% over the past 24 hours, breaking below the key $130…
- Price Analysis
Bitcoin Price Outlook: Capriole Founder Warns of a Drop Below $50K by 2028
Bitcoin price narratives continue to evolve as long-term downside risks regain attention. Bitcoin price discussions…
- Price Analysis
XRP Price Rare Pattern Points to a Surge to $3 as ETFs Cross $1B Milestone
XRP price dropped by 1.2% today, Dec. 17, continuing a downward trend that started in…