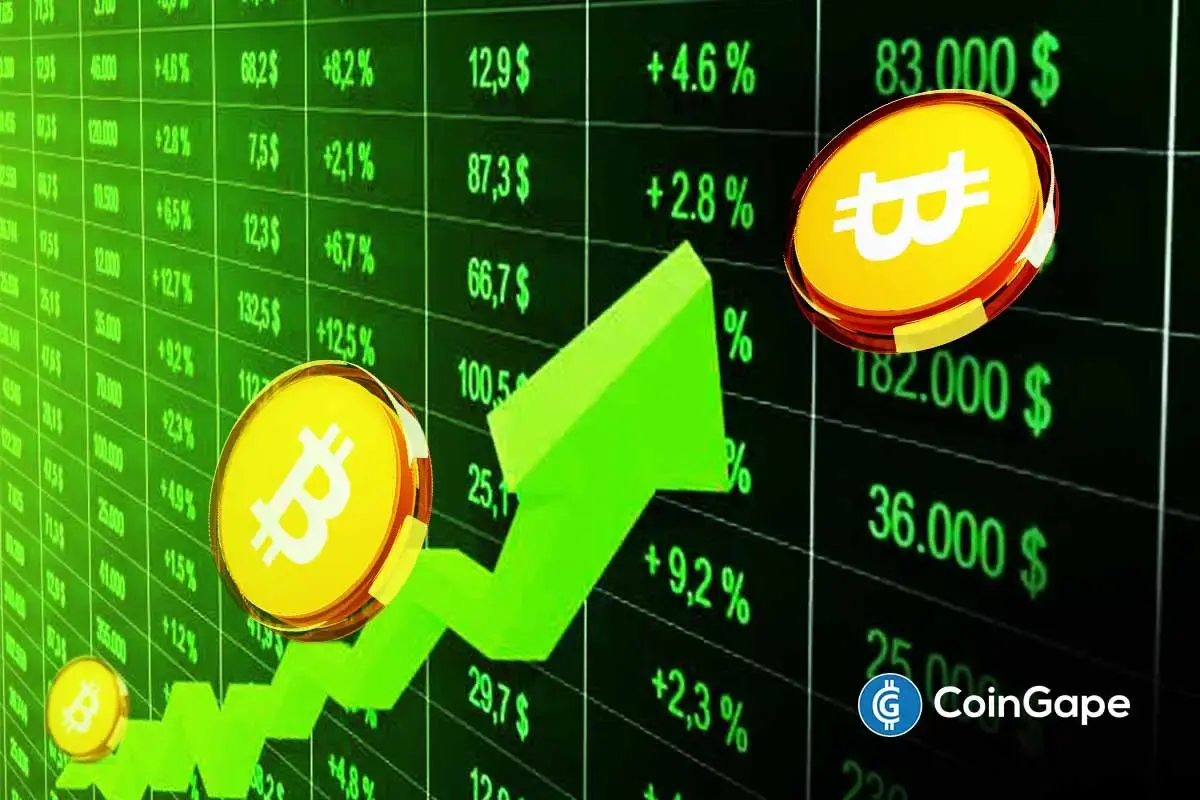
Bitcoin Price Prediction: This Chart Pattern Can Determine if BTC Will Rally 15% or Tumble 10%


Bitcoin Price Prediction: The ongoing recovery in Bitcoin hit a minor roadblock at $18200-18000 resistance and shifted its price trend sideways. Since last week, the coin price is wavering below the aforementioned resistance indicating the buyers struggled to sustain at higher levels. However, in the 4-hour time frame chart, this consolidation has revealed a famous bullish continuation pattern called pennant. Here’s how this pattern can assist Bitcoin to resume prior recovery.
Key Points
- The formation of a bullish pennant pattern indicates the Bitcoin price is witnessing a temporary consolidation before the recovery rally resumes.
- The bullish outlook will reverse if the BTC price breached the chart pattern’s support trendline
- The intraday trading volume in Bitcoin is $14.5 Billion, indicating an 8.09% gain.
 Source-Tradingview
A pennant pattern is formed when a sharp price movement occurs, followed by a period of consolidation which creates a triangular pattern on the chart. In theory, this triangular consolidation offers a short period for traders to recuperate the prior trend momentum.
Also Read: What Is Regenerative Finance (Refi) And Who Is It For?
Thus, under the influence of this pattern, the BTC/USDT pair is currently resonating between two converging trendlines, gradually narrowing its price spread. Once the coin price reaches the peak of the triangle pattern, the breakout movement will be inevitable and trigger a directional move in the technical chart.
With a higher possibility, the Bitcoin price may breach the overhead trendline which will be the key signal for uptrend continuation. The post-breakout rally could drive the Bitcoin price above the $28000-$28200 barrier and challenge the higher levels of the chart such as $31500, and $36100.
On a contrary note, a breakdown below the pattern’s support trendline will invalidate the bullish thesis and may trigger a short correction phase to $25000.
Technical Indicator
Relative Strength Index: the RSI slope wavering around the midline indicates a neutral sentiment among the market participants.
Exponential Moving Average: In the 4-hour time frame chart, the 50 EMA slope acts as a dynamic support and assists buyers to prevent a price breakdown.
Bitcoin Price Intraday Levels
- Spot rate: $27871
- Trend: Bearish
- Volatility: High
- Resistance levels- $28000-$28300 and $31500
- Support levels- $26400 and $25200-$25000

Why Trust CoinGape
CoinGape has covered the cryptocurrency industry since 2017, aiming to provide informative insights Read more…to our readers. Our journal analysts bring years of experience in market analysis and blockchain technology to ensure factual accuracy and balanced reporting. By following our Editorial Policy, our writers verify every source, fact-check each story, rely on reputable sources, and attribute quotes and media correctly. We also follow a rigorous Review Methodology when evaluating exchanges and tools. From emerging blockchain projects and coin launches to industry events and technical developments, we cover all facets of the digital asset space with unwavering commitment to timely, relevant information.

Related Articles


- Dogecoin ETF by 21Shares Gains Approval to Launch This Week
- Coinbase Pushes Back as CLARITY Act Faces DeFi and Stablecoin Reward Ban Debate
- Tether At Center Stage in US Venezuela Conflict As 80% Oil Revenue Stays in Stablecoin
- Crypto Gains 500M-User Gateway as X Teases Roll Out of Smart Cashtags for Real-Time Price Tracking
- Michael Saylor Posts “Big Orange” — Is Another Massive BTC Purchase Coming Tomorrow?
- Binance Coin Price Target $1,000 as CZ Signals Incoming Crypto Super Cycle
- Bitcoin and XRP Price Prediction Ahead of Supreme Court Tariffs Ruling on Jan 14, 2026
- Crypto Price Prediction Ahead of US CPI Inflation Data- ETH, ADA, Pi Coin
- XRP Price Outlook Ahead of Jan 15 CLARITY Act Vote
- Bitcoin Price Prediction: Digital Gold in Focus Amid US Strategic Crypto Reserve Talks
- Pi Network Price Prediction Ahead of 2026 First Upgrade


