BNB Price Analysis: Dip to $200 Perfect Buy or a Bearish Act in Play?
The Binance coin has been in aggressive correction mode since August’s second week. From a high of $248, the coin’s market value tumbled 16.7% and reached the current trading price of $206. This high momentum breakdown has recently breached the monthly support of $200, indicating that crypto holders may witness further downfall. Should you sell on this?
Also Read: Venus Protocol Faces Binance Coin (BNB) Liquidation Risk
Binance Coin Daily Chart: Key Points
- The $220 support breakdown sets altcoin for a 10% drop
- A bullish breakout from the overhead resistance will signal a change in market sentiment.
- The intraday trading volume in the BNB coin is $545.4 Million, indicating a 30% loss
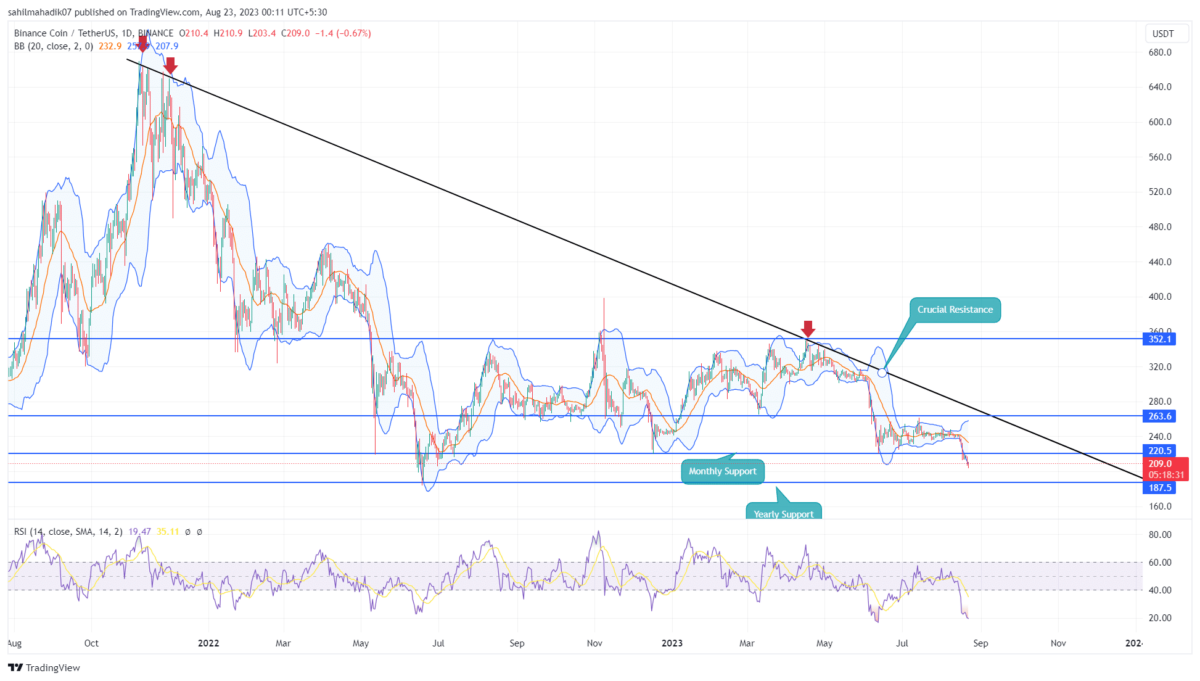
Amid increasing bearishness in the crypto market, the BNB price gave a massive breakdown from the $220 support on August 17th. After a minor retest phase, the coin price tumbled 6.7% in the last three days and currently exchange hands at $206.
However, the daily time frame chart shows no significant support before the $200 level indicating the BNB price posed for another 10%. The buyers will retest this support after a year and should provide a strong footing for potential investors.
While the selling momentum is aggressive it’s too early to expect a reversal from the aforementioned support. However, for interested traders, a better confirmation for a recovery rally or trend reversal would be a breakout from the overhead trendline.
Can Binance Coin Recovery Back to 350?
The daily time frame chart, a descending trendline has marked the current correction trend in BNB price. The altcoin has turned down thrice from the resistance trendline indicating the traders are aggressively following selling at bullish bounces. Thus a bullish breakout from the barrel could bolster buyers for the first $350
- Bollinger Band: The BNB price challenging the lower band Bollinger Band indicator reflects high momentum selling among trades.
- Relative Strength Index: The daily RSI slope at the oversold region indicates a high possibility for a bullish reversal.
Recent Posts
- Price Analysis
Pi Coin Price Prediction as Expert Warns Bitcoin May Hit $70k After BoJ Rate Hike
Pi Coin price rose by 1.05% today, Dec. 18, mirroring the performance of Bitcoin and…
- Price Analysis
Cardano Price Outlook: Will the NIGHT Token Demand Surge Trigger a Rebound?
Cardano price has entered a decisive phase as NIGHT token liquidity rotation intersects with structural…
- Price Analysis
Will Bitcoin Price Crash to $74K as Japan Eyes Rate Hike on December 19?
Bitcoin price continues to weaken after breaking below its recent consolidation range, now trading within…
- Price Analysis
Bitwise Predicts Solana Price Will Hit New All-Time Highs in 2026
Solana price declined by 4% over the past 24 hours, breaking below the key $130…
- Price Analysis
Bitcoin Price Outlook: Capriole Founder Warns of a Drop Below $50K by 2028
Bitcoin price narratives continue to evolve as long-term downside risks regain attention. Bitcoin price discussions…
- Price Analysis
XRP Price Rare Pattern Points to a Surge to $3 as ETFs Cross $1B Milestone
XRP price dropped by 1.2% today, Dec. 17, continuing a downward trend that started in…