BTC Price Prediction: Bullish Pattern in Play Hints 8.5% Jump Ahead
At the August end, the Bitcoin price witnessed a momentary surge of 10%, trying to restore recovery sentiment in the market. However, the momentum was short-lived as the price quickly retreated to the local support at $25500, extending its consolidation phase. Is this support enough to trigger a fresh recovery rally?
Also Read: BTC Price Short-Term Holders Capitulation Persists, 26% Drop On The Cards?
Bullish Chart Pattern Foretells Potential Upswing
- The technical chart projects the demand pressure at $25000 is active.
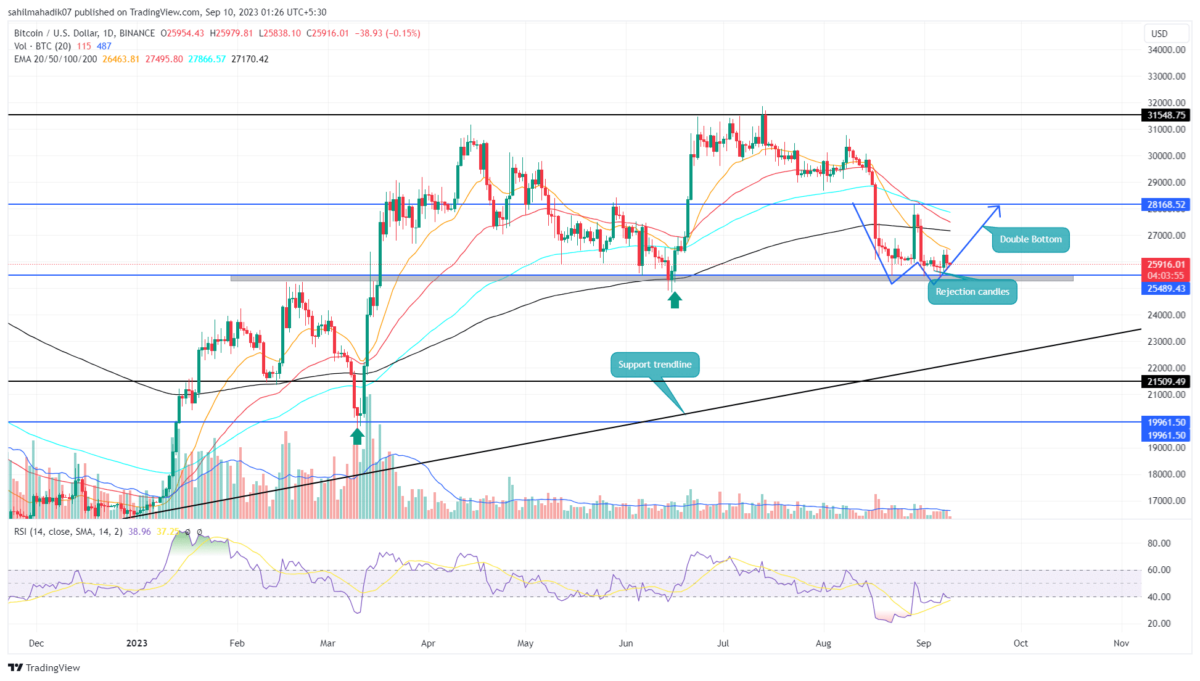
- A bullish breakout from the $28168 barrier will surge the coin price by 8.5%
- The intraday trading volume in Bitcoin is $5.9 Billion, indicating a 56.5% loss.
The daily time frame chart reflects multiple lower price rejection candles at $25500 support, indicating the buyers continue to defend this level.
Concerning this support, the technical chart suggests the possibility of a double-bottom formation. This chart setup is often spotted at the bottom of a downtrend, projecting an increase in demand pressure for a bullish reversal.
By the press time, the BTC price traded at $259006, with an intraday loss of 0.19%.
If the current pattern follows through, the buyers would likely break past the $28,168 neckline resistance. This breakout would be a better signal of a bullish recovery and may push the prices to $31,548.
[converter id=”btc-bitcoin” url=”https://coingape.com/price/converter/btc-to-usd/”]
Will BTC Price Lose $25500 support?
It’s also worth noting that despite experiencing multiple rejections at the $25,489 support, the buyers failed to establish a significant rebound. This reflects weakness in bullish momentum and the possibility of $25000. This breakdown will invalidate the aforementioned pattern and push the prices to the $24000 mark
- Exponential Moving Average: A possible death crossover between 50-and-200 EMA would encourage sellers for prolonged consolidation.
- Relative Strength Index: Considering the same price bottom at $25500, the daily RSI slope a significant rally indicating the rising accumulation from traders.
Recent Posts
- Price Analysis
Will Solana Price Hit $150 as Mangocueticals Partners With Cube Group on $100M SOL Treasury?
Solana price remains a focal point as it responds to both institutional alignment and shifting…
- Price Analysis
SUI Price Forecast After Bitwise Filed for SUI ETF With U.S. SEC – Is $3 Next?
SUI price remains positioned at a critical intersection of regulatory positioning and technical structure. Recent…
- Price Analysis
Bitcoin Price Alarming Pattern Points to a Dip to $80k as $2.7b Options Expires Today
Bitcoin price rebounded by 3% today, Dec. 19, reaching a high of $87,960. This rise…
- Price Analysis
Dogecoin Price Prediction Points to $0.20 Rebound as Coinbase Launches Regulated DOGE Futures
Dogecoin price has gone back to the spotlight as it responds to the growing derivatives…
- Price Analysis
Pi Coin Price Prediction as Expert Warns Bitcoin May Hit $70k After BoJ Rate Hike
Pi Coin price rose by 1.05% today, Dec. 18, mirroring the performance of Bitcoin and…
- Price Analysis
Cardano Price Outlook: Will the NIGHT Token Demand Surge Trigger a Rebound?
Cardano price has entered a decisive phase as NIGHT token liquidity rotation intersects with structural…