

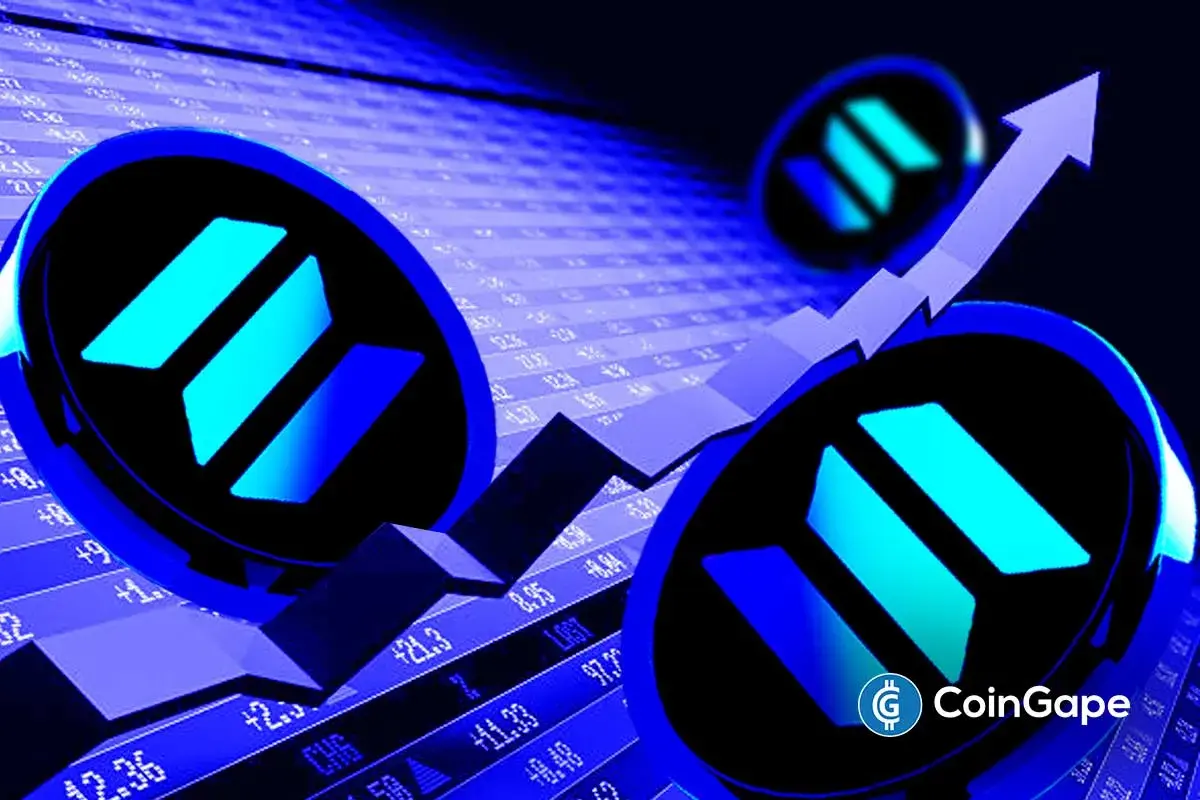
Bullish Pattern Emerged In XRP Weekly Price Chart; Should You Buy?


Over the past three months, the weekly technical chart shows two swing lows bounced back from the $0.315 support. In addition, the W-shaped formation in the chart reveals the shape of a double bottom pattern. This bullish reversal pattern is pretty standard at the market bottom, bolstering a significant recovery after proper execution. Will XRP price hit $0.48 mark?
Key points:
- A bullish-RSI divergence shows a higher possibility for price recovery.
- The 20 EMA resistance in the weekly chart could encourage the failure of a bullish pattern.
- The intraday trading volume in the XRP is $3.9 Billion, indicating a 41% gain.
 Source- Tradingview
The two bullish reversals from the $0.135 support indicate the traders are actively buying at the level. As a result, the XRP price rallied 33% over the fortnight and marked a high of $0.421.
On September 20th, this bull run gave a massive breakout from the $0.39 neckline resistance. Thus, surpassing a resistance level after the support reversal provides additional confirmation for a future rally.
Earlier today, the XRP price chart showed a 5% intraday loss and retested the $0.39 level as potential support. However, by the pressure, the buyers have recovered some losses and displayed a lower price rejection candle.
This low-wick rejection candle shows sustainability above the $0.39 support, providing an entry opportunity to interested buyers. With sustained buying, the XRP price could rally 20% higher to $0.48 resistance.
On a contrary note, if the buyers cannot sustain above the $0.39 level, closing below will extend a sideways rally above $0.315.
Technical Indicator
EMAs: Along with neckline breakout, the XRP price reclaimed the 100-day EMA slope. Moreover, the coin chart reflects a buy signal with the bullish crossover between the 20-and-50-day EMA.
Relative Strength Index: The daily RSI slope shows a significant bullish divergence for the two swing lows within the price pattern. This divergence supports the completion of the bullish pattern and recovery theory.
XRP price intraday level
- Spot rate: $0.40
- Trend: Bearish
- Volatility: Medium
- Resistance levels: $0.425 and $0.45
- Support levels: $0.39 and $0.31

Why Trust CoinGape
CoinGape has covered the cryptocurrency industry since 2017, aiming to provide informative insights Read more…to our readers. Our journal analysts bring years of experience in market analysis and blockchain technology to ensure factual accuracy and balanced reporting. By following our Editorial Policy, our writers verify every source, fact-check each story, rely on reputable sources, and attribute quotes and media correctly. We also follow a rigorous Review Methodology when evaluating exchanges and tools. From emerging blockchain projects and coin launches to industry events and technical developments, we cover all facets of the digital asset space with unwavering commitment to timely, relevant information.
Premium Partners


Related Articles


- Nearly $50M in USDT Stolen After Address Poisoning Scam Targets Crypto Trader Wallet
- Breaking: Rep. Max Miller Unveils Crypto Tax Bill, Includes De Minimis Rules for Stablecoins
- XRP Holders Eye ‘Institutional Grade Yield’ as Ripple Engineer Details Upcoming XRPL Lending Protocol
- Michael Saylor Sparks Debate Over Bitcoin’s Quantum Risk as Bitcoiners Dismiss It as ‘FUD’
- Ethereum Faces Selling Pressure as BitMEX Co-Founder Rotates $2M Into DeFi Tokens
- Will Solana Price Hit $150 as Mangocueticals Partners With Cube Group on $100M SOL Treasury?
- SUI Price Forecast After Bitwise Filed for SUI ETF With U.S. SEC – Is $3 Next?
- Bitcoin Price Alarming Pattern Points to a Dip to $80k as $2.7b Options Expires Today
- Dogecoin Price Prediction Points to $0.20 Rebound as Coinbase Launches Regulated DOGE Futures
- Pi Coin Price Prediction as Expert Warns Bitcoin May Hit $70k After BoJ Rate Hike
- Cardano Price Outlook: Will the NIGHT Token Demand Surge Trigger a Rebound?


