
Bullish Pattern Sets PancakeSwap Coin Recovery To Exceed $5


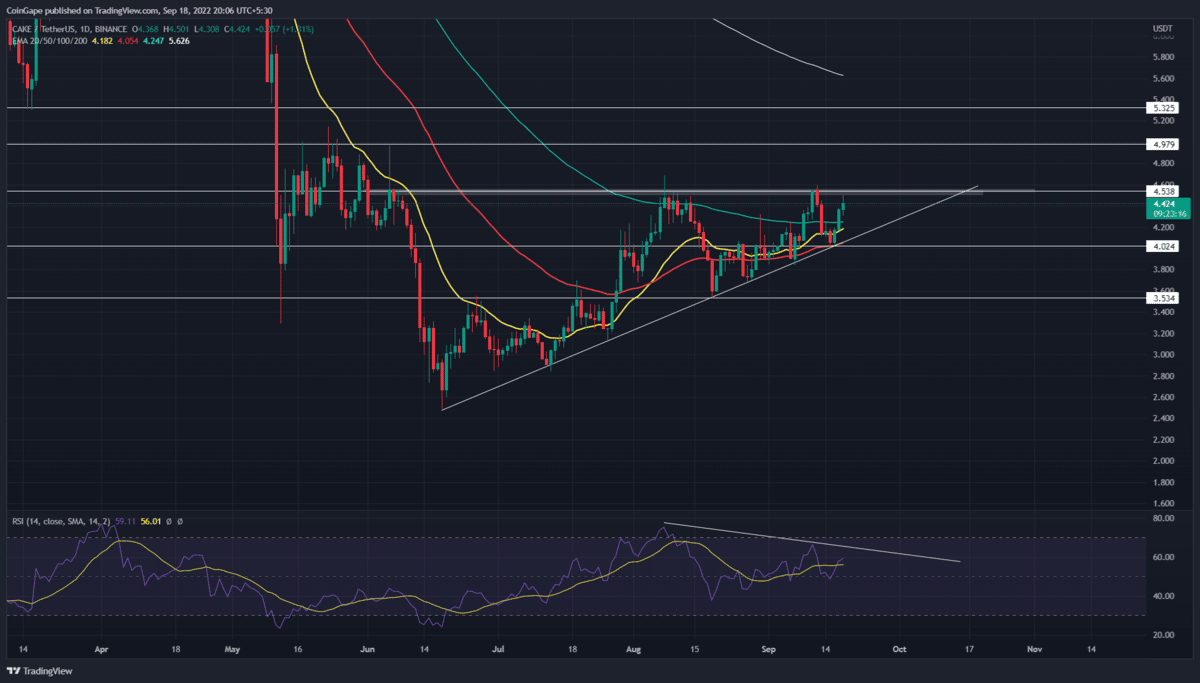
The ongoing recovery in PancakeSwap price follows an ascending triangle pattern. In theory, this bullish pattern indicates a gradual growth in bullish momentum, which receives a sudden boost once the neckline resistance is breached. Thus, the coin holders should keep a close eye on the $4.55 neckline and ascending trendline of the pattern as they will significantly impact the Cake token’s future price.
Key points:
- A support trendline maintains the Pancakeswap price recovery for past
- The 20-and-100-day EMA closing a bullish crossover could attract more buyers to the market.
- The intraday trading volume in the Litecoin coin is $50.1 Million, indicating a 53% gain.
 Source- Tradingview
Amid the recent correction in the crypto market, which plunged the Bitcoin price below $2000, the pancake price turned down from the $4.55 neckline. This downfall registered an 11.5% loss and slumped the prices to the combined support of $4, support trendline, and 50-day EMA.
The PancakeSwap coin price has rebounded from this trendline multiple times, indicating the traders are actively buying at this level. Thus, on September 16th, the altcoin rebounded from accumulated supports with a tweezer bottom candle pattern.
As a result, the coin price rose 11.5% higher and hit the neckline of $4.55. Earlier today, CAKE buyers attempted to breach the resistance, registering a 3% intraday gain, but now it represents a long-tail rejection candle.
This higher price rejection indicates the sellers are defending this level aggressively and could resume another bear cycle within the pattern. If this theory works out, the altcoin will retest the bullish commitment at the support trendline.
However, the bullish pattern would eventually encourage buyers to break the $4.55 resistance. The daily candle closing above this level will accelerate the buying momentum and lead pancakeswap recovery rally to $6.5 mark.
Conversely, a possible breakdown from the support trendline undermines the bullish theory and could pull the price below the $3.5 support.
Anyhow, it seems the price spread within the pattern is short enough to be considered a no-trading zone. Thus, interested buyers should wait for a breakout opportunity before entering the market.
Technical indicator
Relative strength index: the daily-RSI slope shows a bearish divergence concerning the last two retests to $4.55 resistance. This supports the trendline breakdown theory and indicates that buyers are getting weak at higher prices.
EMAs: the 50-day EMA dynamic support provides additional support for pancake price recovery.
- Resistance Levels: $4.5 and $5
- Support Levels: $4 and $3.85

Why Trust CoinGape
CoinGape has covered the cryptocurrency industry since 2017, aiming to provide informative insights Read more…to our readers. Our journal analysts bring years of experience in market analysis and blockchain technology to ensure factual accuracy and balanced reporting. By following our Editorial Policy, our writers verify every source, fact-check each story, rely on reputable sources, and attribute quotes and media correctly. We also follow a rigorous Review Methodology when evaluating exchanges and tools. From emerging blockchain projects and coin launches to industry events and technical developments, we cover all facets of the digital asset space with unwavering commitment to timely, relevant information.