Bullish RSI Divergence Hints 10% Relief Rally In Bitcoin Price


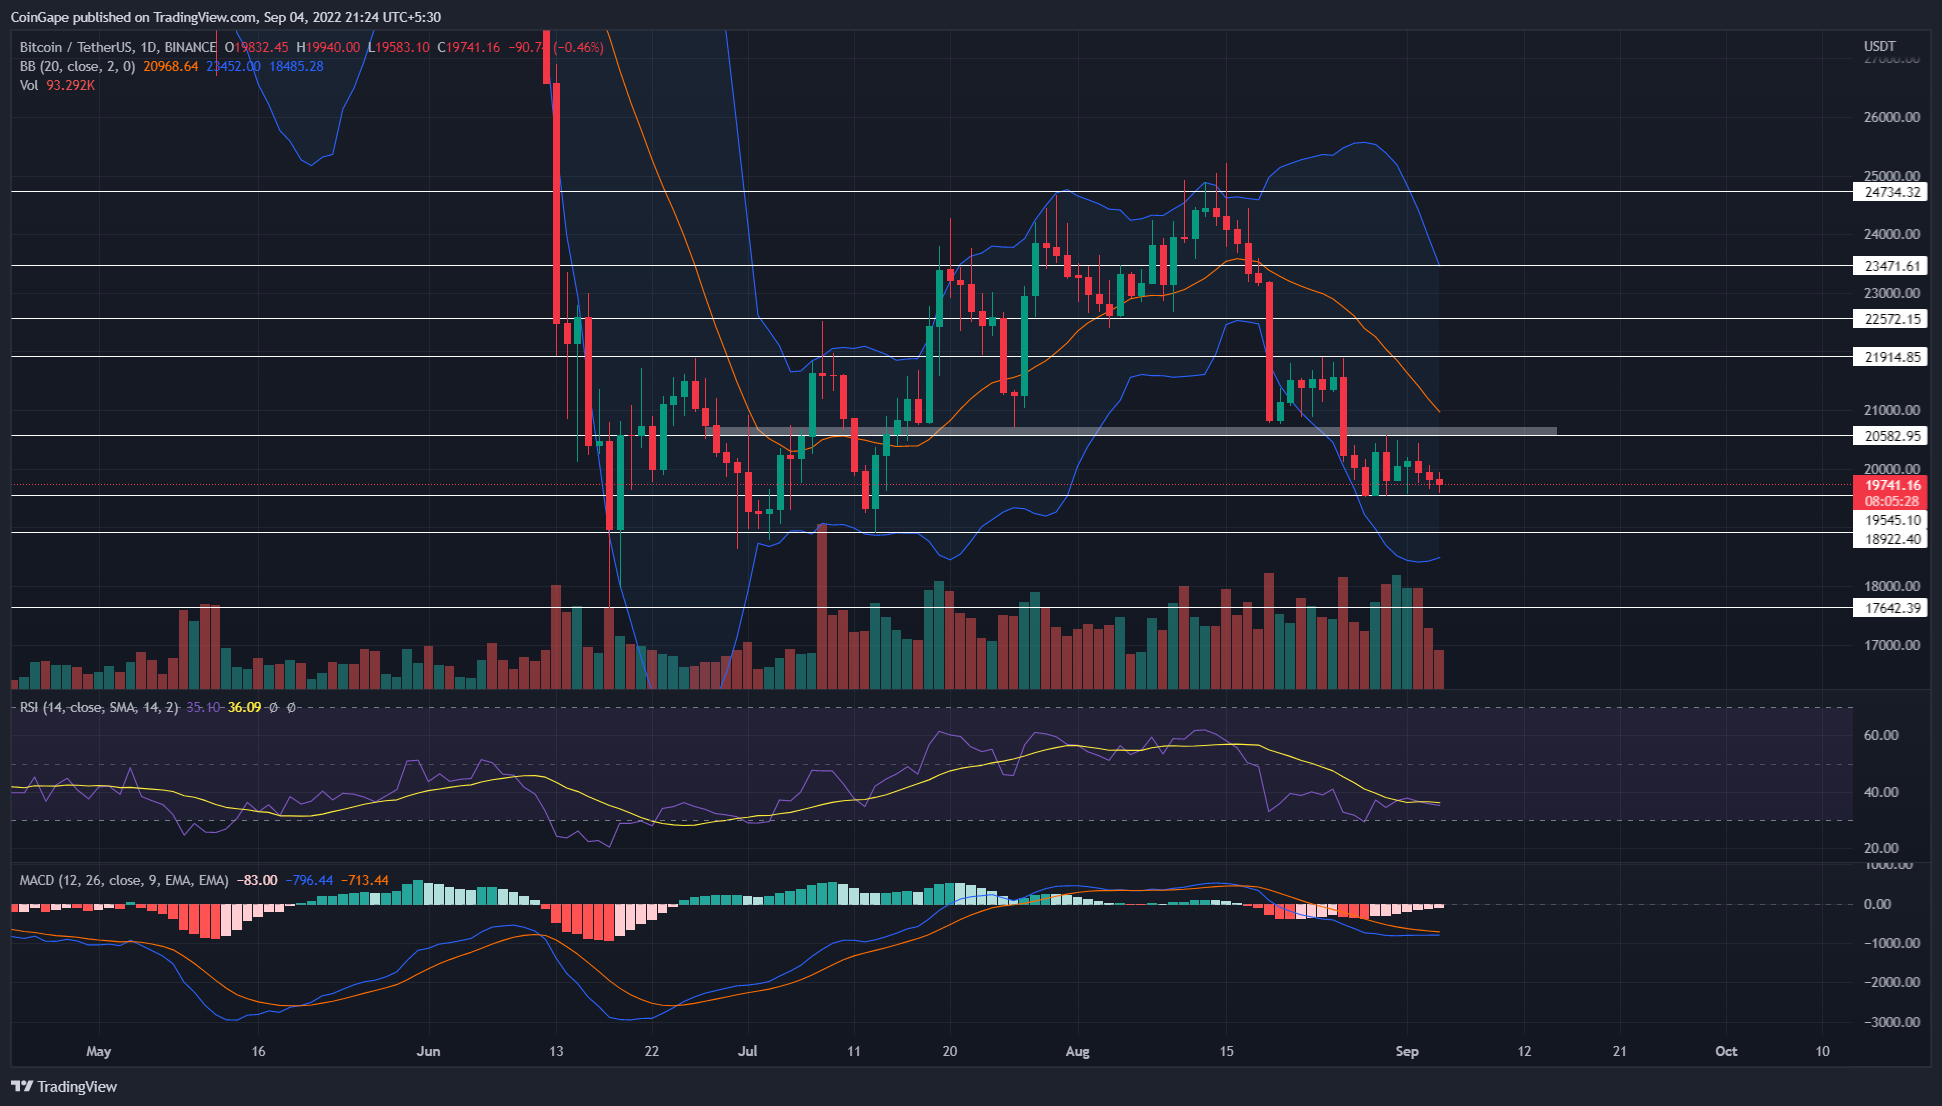
Today, the Bitcoin price is trading at the $19723 mark and had earlier retested the weekly support of $19500. The long tail-rejection attached to the daily candle back by decreasing volume increases the likelihood of bullish reversal. Can the potential bull run reclaim the $20600 mark?
Key points from Bitcoin price analysis:
- The BTC buyers obtained significant support at $19550
- The Bitcoin price action remained trapped in a narrow range
- The intraday trading volume in Bitcoin is $24.3 Billion, indicating a 13.5% loss
 Source-Tradingview
Following the August second-half sell-off, the Bitcoin price plunged to $19500 support and initiated a consolidation phase. This downfall has offset around 75% of gains recorded during the June to early august recovery and plummeted the prices by 22.5%.
Earlier this week, the Bitcoin price attempted to recover higher but failed to surpass the nearest resistance of $20750. As a result, the coin price entered a narrow consolidation between the $20750 and $19500.
Furthermore, the failed attempt mentioned above slumped the BTC price back to the $19500 mark. However, the decreasing volume during this bearish reversal reflects that the seller’s hand is weakening as we approach the lower support.
Such volume activity with a long lower price rejection indicates a higher possibility for a bullish reversal. Thus, if the buyers pierce the $20750 resistance, the Bitcoin price may witness a longer relief rally before continuing the bear trend.
A bullish reversal may surge prices by 10.5 or $14.5% to hit the $21900 or $22600 resistance, respectively. However, a bullish breakout above $22600 would weaken the bearish momentum and bolster buyers for a $25000 breakout.
On the flip side, if the Bitcoin price took an immediate reversal from the $20750 resistance, the consolidation range would extend longer and possibly breach the lower support.
A breakdown below $19500 will prolong the correction phase to $18865 or $18000.
Technical Indicator
Bollinger band: the coin price trading quite below the middle line reflects an aggressive selling in the market. Moreover, a possible reversal may face dynamic resistance from this midline.
RSI indicator: A bullish divergence in daily-RSI slope bolsters price reversal from the $19500
MACD indicator: the fast and slow slope drawn close to each other displays the buyers’ attempt to regain trend control. A potential bullish crossover between these will encourage the $20750 breakout.
- Resistance level- $207501 and $22000
- Support level- $19550 and $18865

Why Trust CoinGape
CoinGape has covered the cryptocurrency industry since 2017, aiming to provide informative insights Read more…to our readers. Our journal analysts bring years of experience in market analysis and blockchain technology to ensure factual accuracy and balanced reporting. By following our Editorial Policy, our writers verify every source, fact-check each story, rely on reputable sources, and attribute quotes and media correctly. We also follow a rigorous Review Methodology when evaluating exchanges and tools. From emerging blockchain projects and coin launches to industry events and technical developments, we cover all facets of the digital asset space with unwavering commitment to timely, relevant information.

Related Articles


- Trump’s Truth Social Files For Bitcoin, Ethereum, Cronos Crypto ETFs Amid Institutional Outflows
- Trump Tariffs: U.S. Supreme Court Sets February 20 for Potential Tariff Ruling
- Brazil Targets 1M BTC Strategic Reserve to Rival U.S. Bitcoin Stockpile
- Breaking: U.S. CPI Inflation Falls To 4-Year Low Of 2.4%, Bitcoin Rises
- Bitget Launches Gracy AI For Market Insights Amid Crypto Platforms Push For AI Integration
- Bitcoin Price Outlook As Gold And Silver Lose $3.6 Trillion in Market Value
- XRP and Ethereum Price Prediction as Trump Seeks to Lower Key Tariffs
- Solana Price Prediction as $2.6 Trillion Citi Expands Tokenized Products to SOL
- Bitcoin Price Could Fall to $50,000, Standard Chartered Says — Is a Crash Coming?
- Cardano Price Prediction Ahead of Midnight Mainnet Launch
- Pi Network Price Prediction as Mainnet Upgrade Deadline Nears on Feb 15


