Bullish RSI Divergence Hints MANA Price Likely To Rebound From $0.71


The Decentraland (MANA) price showed wavering price action at the $0.755-$0.71 support zone. However, despite a lower low in price action, the RSI indicator displaying growth indicates that the traders are interested in buying activity. Therefore, a bullish reversal could surpass the $0.82 barrier and open the door for a potential rally to the $1.13 mark.
Key points:
- The RSI bullish divergence for price action at $0.71 indicates upcoming growth
- The bullish breakout from $0.82 will give additional confirmation for a bullish recovery
- The intraday trading volume in the Decentraland Token is $114.3 Million, indicating a 24.5% loss
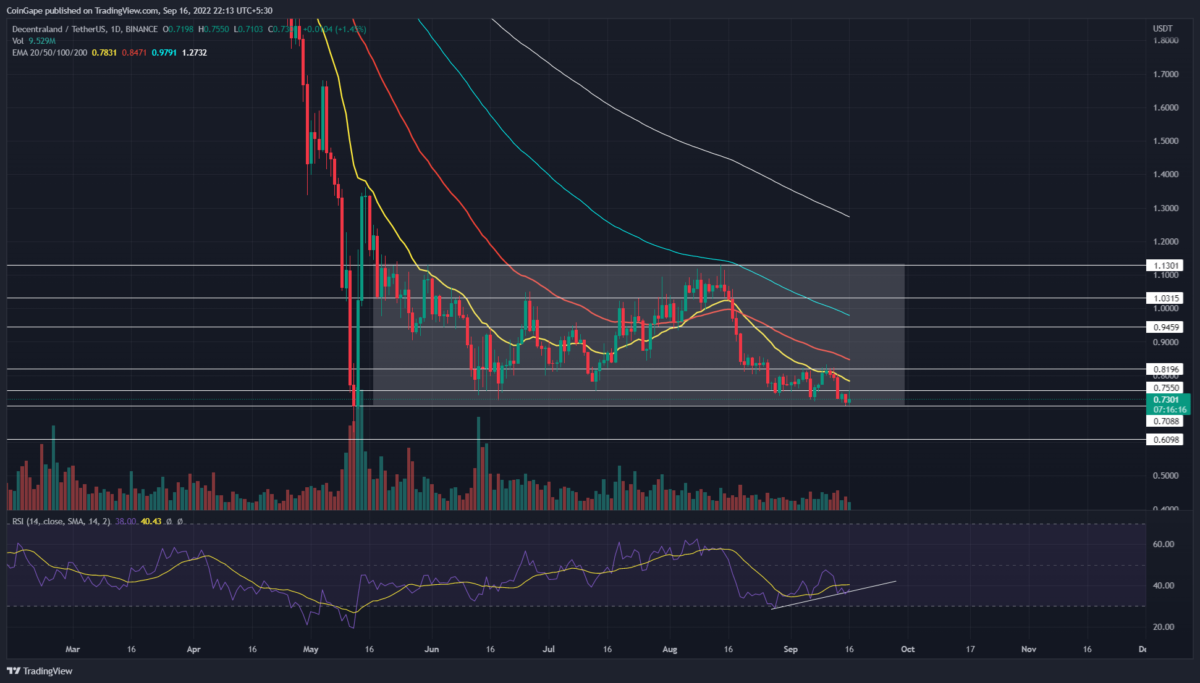
 Source-Tradingview
The MANA/USDT pair has been under a sideways rally for the past four months. Thus, in this range-bound movement, the $1.13 resistance has acted as a bullish limiter, and on the other hand, the $0.755 to $0.71 support zone has provided an active accumulation zone.
Following the August second-half correction and recent sell-off due to the release of high CPI data, the MANA price sank to the $0.71 support. However, the altcoin has retested this support zone multiple times, resulting in a significant recovery.
Thus, the buyers could rebound the prices from this level and set a bullish rally to the top resistance of $0.755. However, the buyers first need to reclaim the near supply zone of $0.82 to confirm this potential rally. Other than this, the bull-run may face other resistances, such as $0.946 and $1.03.
On a contrary note, a breakdown below $0.71 would indicate the resumption of the prior downtrend and may lead the MANA prices to $0.61 support.
Technical indicator
EMAs: the downsloping crucial EMAs(20, 50, 100, and 200) accentuate an overall downtrend. Moreover, the falling prices are obtaining dynamic resistance from the 20 day EMA line.
Relative strength index: contrary to the lower lows in price action, the daily RSI slope displaying higher highs indicates an evident bullish divergence. Such alteration in momentum indicators reflects growth in bullish momentum and indicates a high possibility of bullish reversal.
MANA Price Intraday Levels
- Spot rate: $0.73
- Trend: Sideways
- Volatility: High
- Resistance level- $0.82 and $0.94
- Support levels- $0.71 and $0.61

Why Trust CoinGape
CoinGape has covered the cryptocurrency industry since 2017, aiming to provide informative insights Read more…to our readers. Our journal analysts bring years of experience in market analysis and blockchain technology to ensure factual accuracy and balanced reporting. By following our Editorial Policy, our writers verify every source, fact-check each story, rely on reputable sources, and attribute quotes and media correctly. We also follow a rigorous Review Methodology when evaluating exchanges and tools. From emerging blockchain projects and coin launches to industry events and technical developments, we cover all facets of the digital asset space with unwavering commitment to timely, relevant information.

Related Articles


- CLARITY Act: Crypto Group Challenges Banks Proposal With Its Own Bill Suggestions
- Trump’s Truth Social Files For Bitcoin, Ethereum, Cronos Crypto ETFs Amid Institutional Outflows
- Trump Tariffs: U.S. Supreme Court Sets February 20 for Potential Tariff Ruling
- Brazil Targets 1M BTC Strategic Reserve to Rival U.S. Bitcoin Stockpile
- Breaking: U.S. CPI Inflation Falls To 4-Year Low Of 2.4%, Bitcoin Rises
- XRP Price Prediction Ahead of Potential U.S. Government Shutdown Today
- Bitcoin Price Outlook As Gold And Silver Lose $3.6 Trillion in Market Value
- XRP and Ethereum Price Prediction as Trump Seeks to Lower Key Tariffs
- Solana Price Prediction as $2.6 Trillion Citi Expands Tokenized Products to SOL
- Bitcoin Price Could Fall to $50,000, Standard Chartered Says — Is a Crash Coming?
- Cardano Price Prediction Ahead of Midnight Mainnet Launch


