Bullish RSI Divergence Hints MANA Price Likely To Rebound From $0.71
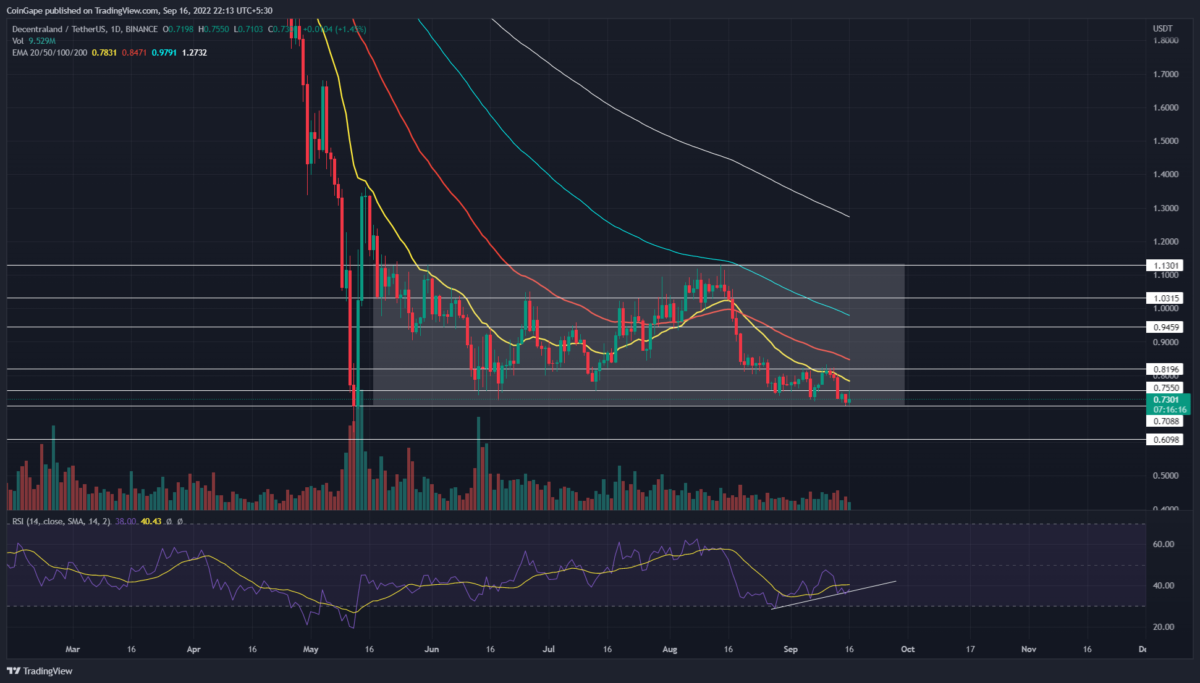
The Decentraland (MANA) price showed wavering price action at the $0.755-$0.71 support zone. However, despite a lower low in price action, the RSI indicator displaying growth indicates that the traders are interested in buying activity. Therefore, a bullish reversal could surpass the $0.82 barrier and open the door for a potential rally to the $1.13 mark.
Key points:
- The RSI bullish divergence for price action at $0.71 indicates upcoming growth
- The bullish breakout from $0.82 will give additional confirmation for a bullish recovery
- The intraday trading volume in the Decentraland Token is $114.3 Million, indicating a 24.5% loss
The MANA/USDT pair has been under a sideways rally for the past four months. Thus, in this range-bound movement, the $1.13 resistance has acted as a bullish limiter, and on the other hand, the $0.755 to $0.71 support zone has provided an active accumulation zone.
Following the August second-half correction and recent sell-off due to the release of high CPI data, the MANA price sank to the $0.71 support. However, the altcoin has retested this support zone multiple times, resulting in a significant recovery.
Thus, the buyers could rebound the prices from this level and set a bullish rally to the top resistance of $0.755. However, the buyers first need to reclaim the near supply zone of $0.82 to confirm this potential rally. Other than this, the bull-run may face other resistances, such as $0.946 and $1.03.
On a contrary note, a breakdown below $0.71 would indicate the resumption of the prior downtrend and may lead the MANA prices to $0.61 support.
Technical indicator
EMAs: the downsloping crucial EMAs(20, 50, 100, and 200) accentuate an overall downtrend. Moreover, the falling prices are obtaining dynamic resistance from the 20 day EMA line.
Relative strength index: contrary to the lower lows in price action, the daily RSI slope displaying higher highs indicates an evident bullish divergence. Such alteration in momentum indicators reflects growth in bullish momentum and indicates a high possibility of bullish reversal.
MANA Price Intraday Levels
- Spot rate: $0.73
- Trend: Sideways
- Volatility: High
- Resistance level- $0.82 and $0.94
- Support levels- $0.71 and $0.61
Recent Posts
- Price Analysis
Cardano Price Outlook: Will the NIGHT Token Demand Surge Trigger a Rebound?
Cardano price has entered a decisive phase as NIGHT token liquidity rotation intersects with structural…
- Price Analysis
Will Bitcoin Price Crash to $74K as Japan Eyes Rate Hike on December 19?
Bitcoin price continues to weaken after breaking below its recent consolidation range, now trading within…
- Price Analysis
Bitwise Predicts Solana Price Will Hit New All-Time Highs in 2026
Solana price declined by 4% over the past 24 hours, breaking below the key $130…
- Price Analysis
Bitcoin Price Outlook: Capriole Founder Warns of a Drop Below $50K by 2028
Bitcoin price narratives continue to evolve as long-term downside risks regain attention. Bitcoin price discussions…
- Price Analysis
XRP Price Rare Pattern Points to a Surge to $3 as ETFs Cross $1B Milestone
XRP price dropped by 1.2% today, Dec. 17, continuing a downward trend that started in…
- Price Analysis
DOGE Whales Add 138M Coins in 24 Hours: Will Dogecoin Price Rebound Above $0.15?
Dogecoin price traded at $0.1304 on Tuesday, up 1.39% in the last 24 hours.…