Buy $ETH at $1700 Dip?; Here’s Why Ethereum Price Remains Bullish in the Long Term


The recent correction phase over the past two months has brought the Ethereum price directly to the long-coming support trendline. From the peak of $2138, the prices plunged to a low of $1627, registering a loss of 23.5%. However, this retracement backed by decreasing volume indicates the lack of commitment from sellers and a higher possibility of a bullish reversal. With a sufficient sign of demand pressure, the ETH price is likely to resume prior to recovery offering an excellent dip opportunity for traders.
Also Read: Will Ethereum Price Crash to $1,450? ETH DeFi TVL Shrinks by $7.84B in One Year
Ethereum Price Daily Chart
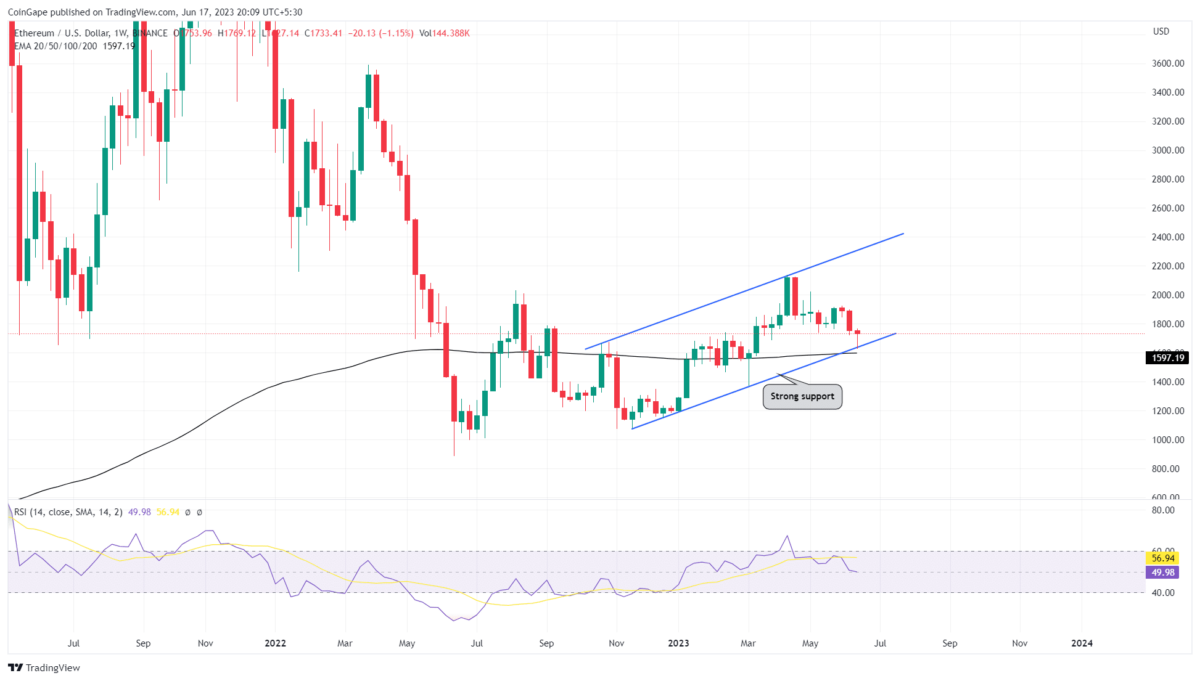
- An ascending support trendline governs the current long-term bullish trend
- Accumulation at crucial support trendline indicates upcoming recovery in ETH price.
- The intraday trading volume in Ether is $5.8 Billion, indicating a 37.5% loss.
 Source-tradingview
 Source-tradingview
In the weekly time frame chart, the ETH price shows a long-tail hammer candle at the ascending trendline. This rejection candle shows active accumulation from buyers and a higher possibility of a bullish reversal.
Moreover, the whole correction phase stayed above the 50% Fibonacci retracement level indicating this pullback health considering the overall uptrend. Previously, when the prices retested this dynamic support, the coin holders witnessed significant recovery, especially in the months of January and March.
Thus, the anticipated bullish reversal could kickstart a new recovery cycle and may push the price above $2138.
Interested traders can enter at this dip with a close stop loss below the hammer wick at $1625. However, the safer traders can enter at the breakout of immediate resistance of $1775.
Can $ETH Price Revisit the $2000?
A retest to the dynamic support trendline could replenish the bullish momentum in the ETH price and end the ongoing correction. The investors buying at this support can expect sustained growth above $2138 but will face in-between resistance at the $1775 and $2000 marks. On a contrary note, a breakdown below the support trendline will invalidate the bullish thesis and can plunge prices back to the $1400 mark.
- Moving Average Convergence Divergence: A bearish crossover between the MACD(blue) and signal(orange) reflect the aggressive influence of sellers and therefore a need for a $1775 breakout to confirm a bullish reversal.
- Exponential Moving Average: The ETH price above 200-day EMA projects long-term growth for ETH remains bullish.

Why Trust CoinGape
CoinGape has covered the cryptocurrency industry since 2017, aiming to provide informative insights Read more…to our readers. Our journal analysts bring years of experience in market analysis and blockchain technology to ensure factual accuracy and balanced reporting. By following our Editorial Policy, our writers verify every source, fact-check each story, rely on reputable sources, and attribute quotes and media correctly. We also follow a rigorous Review Methodology when evaluating exchanges and tools. From emerging blockchain projects and coin launches to industry events and technical developments, we cover all facets of the digital asset space with unwavering commitment to timely, relevant information.

Related Articles


- CLARITY Act: White House to Hold Another Meeting as Crypto and Banks Stall on Stablecoin Yield Deal
- Bitcoin as ‘Neutral Global Collateral’? Expert Reveals How BTC Price Could Reach $50M
- XRP Ledger Validator Spotlights Upcoming Privacy Upgrade as Binance’s CZ Pushes for Crypto Privacy
- Harvard Management Co (HMC) Cuts BlackRock Bitcoin ETF Exposure by 21%, Rotates to Ethereum
- Morgan Stanley, Other TradFi Load Up SOL as Solana RWA Tokenized Value Hits $1.66B ATH
- Ethereum Price Outlook as Harvard Shifts Focus from Bitcoin to ETH ETF
- HOOD and COIN Stock Price Forecast as Expert Predicts Bitcoin Price Crash to $10k
- XRP Price Prediction Ahead of Supreme Court Trump Tariff Ruling
- Crypto Price Prediction For This Week: Dogecoin, Solana and Cardano
- Bitcoin Price Prediction: How Could Brazil’s Strategic Bitcoin Reserve Proposal Impact BTC?
- 3 Top Reasons Pi Network Price Surging Today (14 Feb)


