Can SHIB Price Reclaim $0.000008 Mark Despite Bearish Winds?
The Shiba Inu recovery rally entered a correction phase after hitting $0.00001136. While this pullback was expected to stabilize the memecoin for the higher rally, the increasing bearishness in the crypto market, prolonged the downfall. Within a fortnight, the SHIB price lost a market value of over 25% and breached a local support zone of $0.0000088. Should you sell on this?
Also Read: Shibarium Stops Producing Blocks Again, Whales Dumping SHIB And BONE
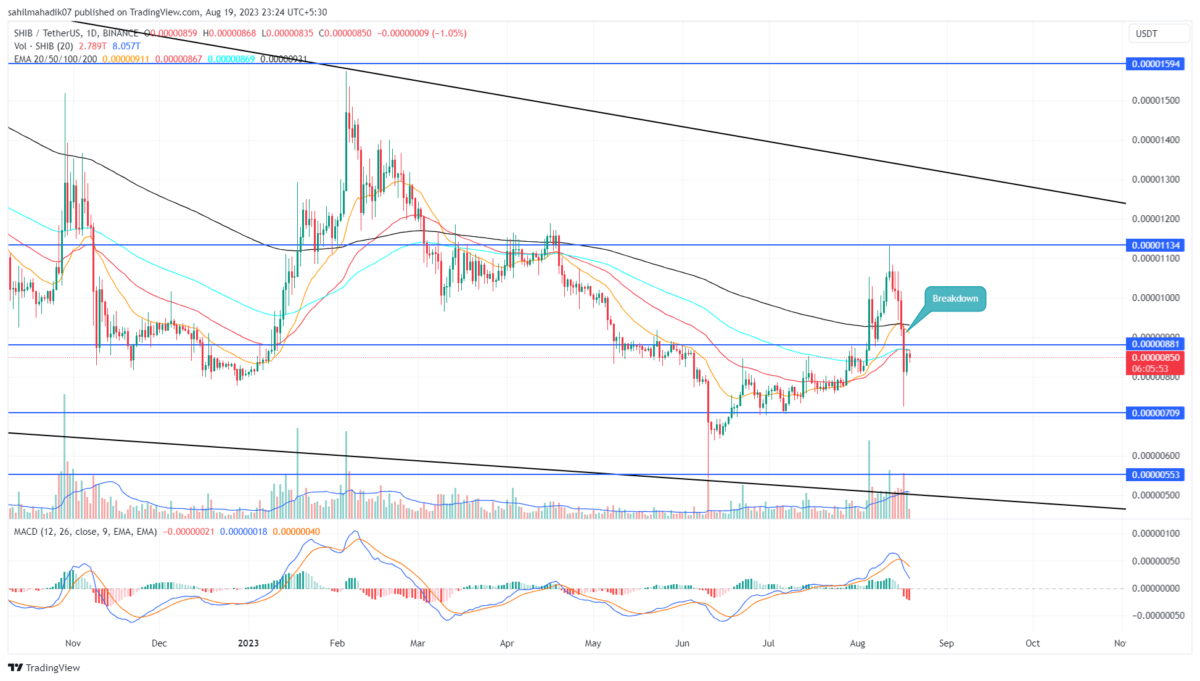
Shiba Inu Price Daily Chart:
- A bearish breakdown from $0.0000088 could bolster sellers for a 17.5% fall.
- A daily EMA(20, 50, 100, and 200) accumulated near $0.0000088 creates a high supply zone
- The intraday trading volume of the Shiba Inu coin is $214.8 Million, showing a 48% loss.
In response to the August 17th bloodbath in the crypto market, the popular memecoin Shiba Inu witnessed an 11.73% intraday loss and slipped below $0.0000088 support. This high volume breakdown reflects sellers are aggressive and could bolster further downfall in the near term.
The SHIB price currently trades at $0.00000856 and witnesses a post-breakdown retest meant to check price stability for trend contention. If the coin price showcases supply pressure at flipped $0.0000088 resistance, the sellers may tumble the memecoin another 17.5% to reach the next support of $0.000007.
If the bearish momentum rises, the Shiba Inu coin may prolong the correction base to the lower trendline of the wedge pattern which is leading the current downward trend.
Will Bulls Stage a Comeback
Taking a close look at the August 17th bearish candle, the daily chart shows a long lower price rejection tail projecting the pressure of demand pressure. Moreover, the seller’s failure to offer a follow-up to the breakdown candle also adds to some weakness in bearish momentum. If the buyers stepped into this uncertainty, the coin price may rise back above $0.0000088. However, the buyers must breach the breakdown candle high of $0.00000936
- Exponential Moving Average: The SHIB price below daily EMAs(20, 50, 100, and 200) reflects the overall market sentiment turning bearish.
- Moving Average Convergence Divergence: A bearish crossover state between the MACD(blue) and signal(orange) indicate high momentum selling in the market.
Recent Posts
- Price Analysis
XRP Price Prediction After Spot XRP ETFs Record the First Outflow in 36 Days?
XRP price has entered a corrective phase after a strong rally failed to hold near…
- Price Analysis
XRP vs Solana Price: Which Could Outperform in January 2026?
XRP price and Solana price enter January 2026 from very different recovery structures despite both…
- Price Analysis
Meme Coin Price Prediction For Jan 2026: Dogecoin, Shiba Inu And Pepe Coin
The meme coin price trend saw a major shift last week as Dogecoin, Shiba Inu,…
- Price Analysis
Pi Coin Price Eyes Rebound to $0.25 as Top Whale Nears 400M Milestone
Pi Coin price remains in a narrow range, continuing a consolidation that started in the…
- Price Analysis
Ethereum Price Prediction Ahead of US data Report
Ethereum price hovered above $3,200 during early Wednesday trade as the market showed signs of…
- Price Analysis
Bitcoin Price Prediction as FOMC Nears: Will 90% No-Cut Probability Pressure BTC?
Bitcoin price continues to trade within a defined range as macro pressure intersects with weakening…