Can This Emerging Pattern Resume LUNC Price Recovery?
The LUNC/USDT witnessed a parabolic recovery from late August to early September, which surged it to a record high of the $0.0006 mark. However, such massive growth in a short period is unhealthy for assets. Thus, the increasing selling pressure at higher levels and profit booking from short-term traders initiated a correction phase.
Key points:
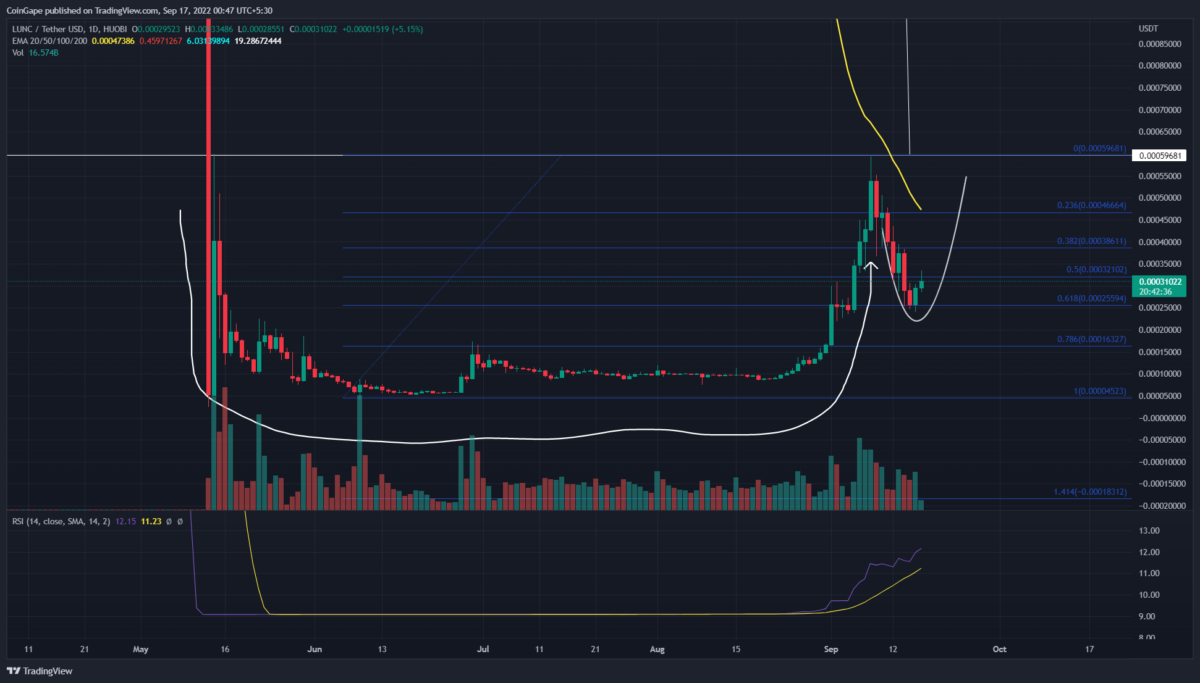
- A daily candle closing above the $0.00032 resistance is needed to bolster further price rally.
- The post-correction rally should rise 85% in response to cup and handle pattern
- The intraday trading volume in the LUNC coin is $1.24 Billion, indicating a 61.544% gain.
The recent sell-off in the crypto market contributed its share to this bearish pullback and plunged the prices to 0.618 Fibonacci retracement level at ($0.000255). Moreover, the downfall discounted the LUNC price by 56.83%.
Furthermore, the buyers managed to obtain suitable support of 0.618 FIB level and rebound with two long bullish candles. The post-correction rally has accounted for 25.8% gains and currently trades at the $0.000321 mark.
Also read: Breaking: Binance To Implement 1.2% Tax Burn For Terra Classic (LUNC) And USTC
Thus, the recovery has breached the immediate resistance of $0.00032, which should give the required confirmation for a price rally to 0.0006.
Anyhow, the prior U-shaped recovery aligned with the recent correction revealed the formation of a cup and handle pattern. This bullish reversal pattern is often found in the market bottom to trigger an early sign of trend reversal.
Thus, even the pattern influence will lead the LUNC price to rechallenge the $0.0006 neckline resistance. With a favorable scenario, a bullish breakout from this neckline will complete the chart pattern and surge the prices to the $0.0013 mark.
Technical Indicator
Relative strength index: the daily-RSI slope didn’t respond much to the recent correction and showed an aggressive rally above the 12-SMA slope.
EMAs: the 20-day EMA nearing the coin price could stall the potential rally midway.
LUNC Price Intraday Levels
- Spot rate: $0.00032
- Trend: Bullish
- Volatility: Low
- Resistance level- $0.00032 and $0.000387
- Support level- $0.000255 and $0.00016
Recent Posts
- Price Analysis
Solana Price Outlook: Will SOL Recover With Strong Institutional Buying?
Solana price remains steady above the $120 support after the recent crypto market pullback. The…
- Price Analysis
Ethereum Price Risks Crash to $2,500 Amid Sustained Wintermute Dumping
Ethereum price dropped below the key support at $3,000 on Tuesday, down by ~40% from…
- Price Analysis
Is It Time to Sell Bitcoin for Gold- Analyst Spots 2023 Pattern That Triggered BTC’s Last Major Rally
The Stock Market rose modestly as crypto market consolidation sparked a fresh Bitcoin vs Gold…
- Price Analysis
Bitcoin Price Prediction and Analysis: Will BTC Hit $100k Before Year-End?
Bitcoin price moves into the final trading sessions with uncertainty around upside continuation. BTC price…
- Price Analysis
Bitcoin Price Prediction As Michael Saylor Pauses BTC Purchase- Is A Fall to $74k Imminent?
Michael Saylor's Strategy has paused additional BTC purchases while increasing cash reserves, prompting renewed speculation…
- Price Analysis
Aster launched Phase 5 Buyback Program Allocating 80% Fees. Will ASTER Price Rally?
Aster price hovered above $0.70 following a 2.67% daily gain, supported by a bullish market…