Can This Upcoming Trendline Prevent Further Downfall In Ethereum Price?
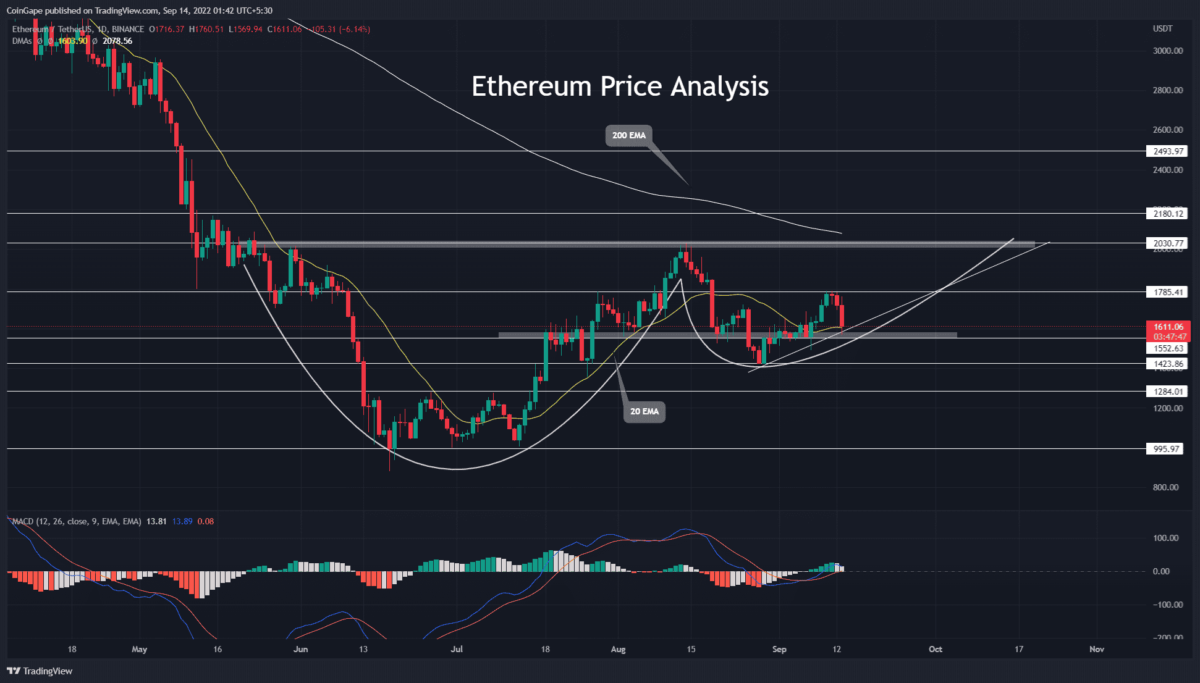
The daily ETH/USDT technical chart shows the formation of a cup and handle pattern. In response to this pattern, the coin price should follow an uptrend direction and break the neckline resistance of $2000. By doing so, the Ethereum price would obtain an early signal for trend reversal which could grab the first target of $2500. However, the coin price currently trades at $1575 and 8% down on the intraday level.
Key points from Ethereum price analysis:
- The Ethereum price has lost 11% in the last three days.
- An upcoming support trendline may assist buying to maintain a recovery rally.
- The intraday trading volume in Ethereum is $22.5 Billion, indicating an insignificant rise of 22.8%.
Today’s sell-off initiated with the fresh data consumer price index(CPI), pointing to an 8.3% YoY inflation. However, the bearish momentum accelerated as the CME Fed Watch Tool showed a 20% chance of a 100 bps or 1% interest rate hike. Thus, the market sentiment is again in turmoil, and questioning has the bottom really formed.
Anyhow, the technical chart currently shows a bullish reversal pattern governing the Ethereum price action, and therefore, traders can keep a bullish outlook until they don’t lose the swing low support of $1430.
As of now, the bearish engulfing candle retests the combined support of $1550 and the upcoming support trendline. However, if today’s daily candle closes above this support, the price holds a recovery opportunity.
A possible reversal from this concentrated support will surge the altcoin 28% higher to hit the neckline of the aforementioned pattern.
On a contrary note, if the selling pressure persists and the daily candle closes below $1550, the price will fall to $1430 and attempt to breach it
Technical indicator-
MACD indicator: the fast and slow lines wavering exactly over the mid-zone indicates a neutral sentiment among the market participants.
EMAs: it seems the EMAs have marked the crucial level of technical chart offering weightage to those levels. Thus, the 20-day EMA at $1550 support assists buying to sustain the bullish pattern. Moreover, the 200-day EMA at $2000 resistance creates an additional barrier against bulls.
- Resistance level- $1785 and $2000
- Support level- $1550 and $1430
Recent Posts
- Price Analysis
Will Solana Price Hit $150 as Mangocueticals Partners With Cube Group on $100M SOL Treasury?
Solana price remains a focal point as it responds to both institutional alignment and shifting…
- Price Analysis
SUI Price Forecast After Bitwise Filed for SUI ETF With U.S. SEC – Is $3 Next?
SUI price remains positioned at a critical intersection of regulatory positioning and technical structure. Recent…
- Price Analysis
Bitcoin Price Alarming Pattern Points to a Dip to $80k as $2.7b Options Expires Today
Bitcoin price rebounded by 3% today, Dec. 19, reaching a high of $87,960. This rise…
- Price Analysis
Dogecoin Price Prediction Points to $0.20 Rebound as Coinbase Launches Regulated DOGE Futures
Dogecoin price has gone back to the spotlight as it responds to the growing derivatives…
- Price Analysis
Pi Coin Price Prediction as Expert Warns Bitcoin May Hit $70k After BoJ Rate Hike
Pi Coin price rose by 1.05% today, Dec. 18, mirroring the performance of Bitcoin and…
- Price Analysis
Cardano Price Outlook: Will the NIGHT Token Demand Surge Trigger a Rebound?
Cardano price has entered a decisive phase as NIGHT token liquidity rotation intersects with structural…