Cardano Price Analysis: Can $ADA Price Hold $0.24 Support Amid Current Market Sell-off?


Cardano Price Analysis: After witnessing a heavy sell-off in the second week of June, the ADA price went sideways above $0.24 support. Over the past six days, the coin chart showed several short-bodied and high-wick candles indicating uncertainty among market participants. Amid this consolidation, the traders can mark the nearest significant levels to check to determine the future prospect of this coin.
Also Read: Cardano Price Analysis: $ADA Price to Face High Volatility Before an Explosive Move; Buy Now?
Cardano Price Daily Chart
- The ADA price may face intense demand pressure at $0.24 support
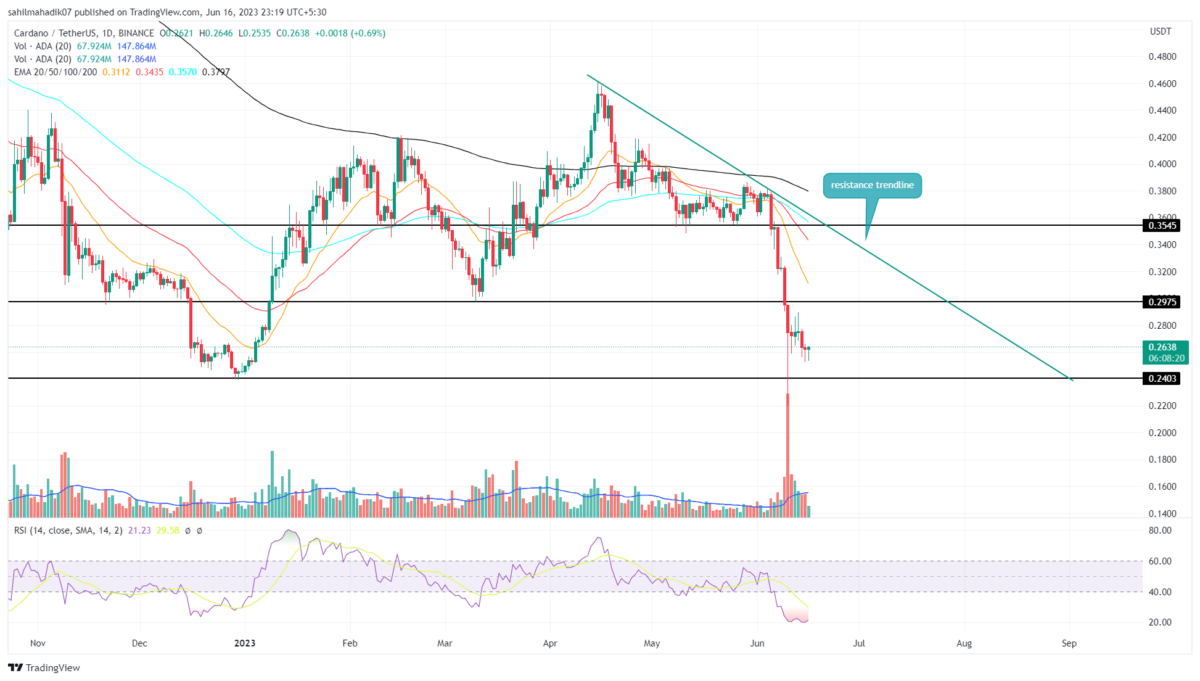
- The sellers may prolong the ongoing correction trend in ADA until the downsloping trendline is intact.
- The intraday trading volume in the ADA coin is $192.5 Million, indicating a 37.35% loss
 Source- Tradingview
On June 10th, the Cardano coin showcased a long-tail rejection candle at $0.24 support. Following a massive sell-off, this buying was mainly due to accumulation for investors entering at discounted prices.
Thus ongoing bearish trends and accumulation from buyers cause the current sideways movement in ADA price. If the overhead supply pressure persists, the prices could plunge to another 8% to revisit the bottom support of $0.24.
This retest could give additional confirmation for a new relief rally in Cardano.
However, in the daily chart, the upside could be limited to a downsloping trendline which is carrying a correction phase over the past two months.
Will Cardano Price Surpass $0.35 Mark?
The current sideways movement in ADA price is likely to stabilize the build-up buying pressure after the excessive sell-off in the coin’s market value. This battle between the buyers and sellers could trigger a range formation between $0.3 and $0.24. However, for buyers to reclaim the $0.35 mark they need a breakout range resistance of $0.3 and an overhead trendline to kickstart a new recovery that could surpass $0.3
- Relative Strength Index: The daily RSI slope at the oversold region reflects an unstable price behavior due to excessive selling and therefore it needs to be balanced by an influx of buying pressure in order to establish a sustainable trend.
- Exponential Moving Average: The 20-day EMA could be a dynamic resistance in a high momentum downtrend.


- Do Kwon Faces Up to 12 Years in Prison Over ‘Colossal’ Role in $40B TerraUSD Collaps
- ProShares Drops 3x Bitcoin, Ethereum, XRP ETF Plans After SEC Pushback
- Bitcoin Eyes Fresh Demand as Indiana Advances Bill for Crypto Investments
- Crypto Bill Markup Unlikely This Month Amid DeFi, Stablecoin Yield and Conflict Disputes, Expert Says
- Breaking: U.S. PCE Inflation Rises To 2.8%, Bitcoin Falls
- Bitcoin Price Forecast as BlackRock Sends $125M in BTC to Coinbase — Is a Crash Inevitable?
- XRP Price Prediction As Spot ETF Inflows Near $1 Billion: What’s Next?
- Solana Price Outlook: Reversal at Key Support Could Lead to $150 Target
- Is Cardano Price at Risk of a 50% Crash Ahead of the Midnight Launch?
- Is Chainlink Price Headed for $20 as Reserves Pass 1M LINK?
- Ethereum Price Breaks Out of Falling Wedge: Next Target Now Set at $5K


Why Trust CoinGape
CoinGape has covered the cryptocurrency industry since 2017, aiming to provide informative insights Read more…to our readers. Our journal analysts bring years of experience in market analysis and blockchain technology to ensure factual accuracy and balanced reporting. By following our Editorial Policy, our writers verify every source, fact-check each story, rely on reputable sources, and attribute quotes and media correctly. We also follow a rigorous Review Methodology when evaluating exchanges and tools. From emerging blockchain projects and coin launches to industry events and technical developments, we cover all facets of the digital asset space with unwavering commitment to timely, relevant information.
Premium Partners


