Cardano Price Analysis: Fake Breakdown Sparks Hope for 26% Recovery
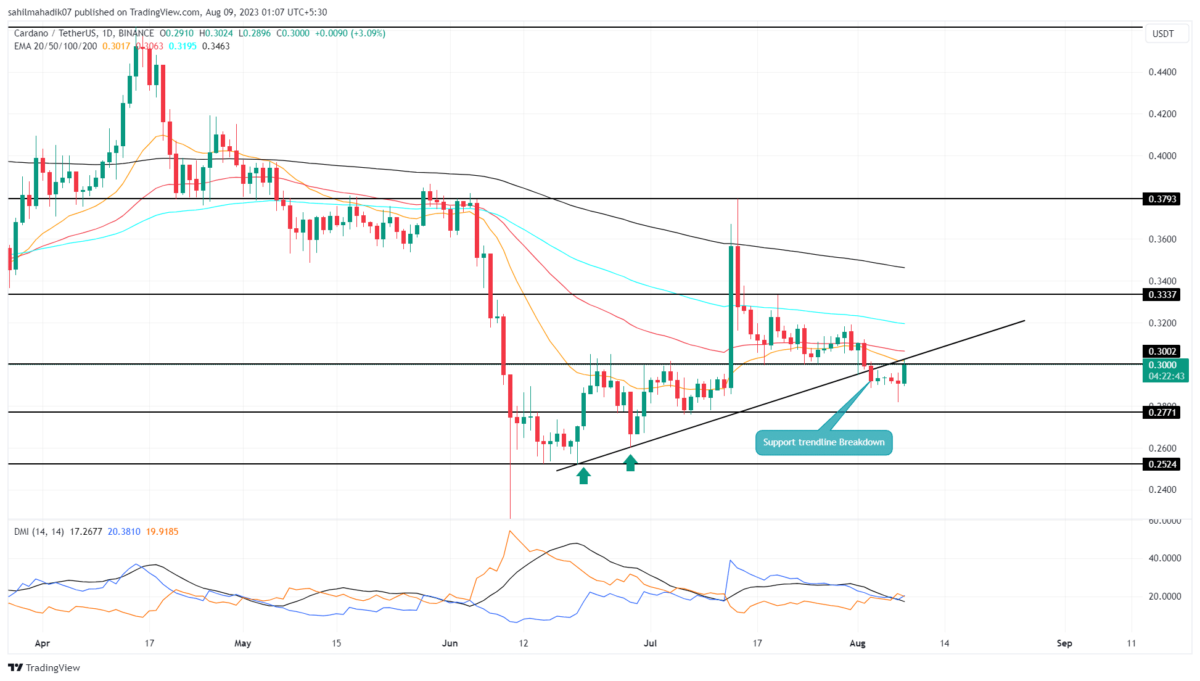
Cardano Price Analysis: On August 3rd, the falling Cardano price gave a bearish breakdown from the combined support of $0.3 and support trendline. Amid the increased uncertainty, this crackdown was expected to trigger a significant correction but the prices went sideways reflecting weakness in bearish momentum. Will buyers take advantage of the ongoing consolidation to kickstart a new recovery cycle?
Also Read: Cardano (ADA) to Expand Mithril Access Via New Partnership
Cardano Price Daily Chart
- The daily chart reflects a fake breakdown from the rising support trendline
- A decisive breakout from the overhead trendline would set the Cardano price for a 26% upswing
- The intraday trading volume in the ADA coin is $300.6 Million, indicating an 18% gain.
Despite the recent breakdown of the rising support trendline, the ADA sellers failed to push the prices lower. The daily chart of August 7th, gives a clear few of active accumulation at the bottom, as the price candle shows a long-tail lower price rejection.
Today, the Cardano price surged 3.23% and reached the current trading price of $0.3. If the buyers manage to reclaim the breached support with a daily candle closing above, the prior breakdown would be marked as a bear trap.
This is a deceptive situation because it lures traders into making pessimistic decisions based on the apparent downtrend, only for the market dynamics to shift in the opposite direction. The potential breakout would be a strong signal for recovery and bolster prices for 26% higher to hit $0.38.
Can ADA Buyers Still Manage to Reclaim $0.3?
The anticipated rally would bolster the formation of a double bottom pattern developing in the daily time frame chart. This pattern reflects high accumulation from buyers, usually leading to a strong upswing. Under the influence of this chart setup, the coin price is set for a rally of $0.46.
- Exponential Moving Average: The daily EMAs(20, 50, 100, and 200) moving higher to ADA price could create additional barriers for trades.
- Direction Moving Average: A potential bullish crossover between the DI+(blue) and DI-(orange) slope would signal the increasing buying pressure in the market.
Recent Posts
- Price Analysis
Will Solana Price Hit $150 as Mangocueticals Partners With Cube Group on $100M SOL Treasury?
Solana price remains a focal point as it responds to both institutional alignment and shifting…
- Price Analysis
SUI Price Forecast After Bitwise Filed for SUI ETF With U.S. SEC – Is $3 Next?
SUI price remains positioned at a critical intersection of regulatory positioning and technical structure. Recent…
- Price Analysis
Bitcoin Price Alarming Pattern Points to a Dip to $80k as $2.7b Options Expires Today
Bitcoin price rebounded by 3% today, Dec. 19, reaching a high of $87,960. This rise…
- Price Analysis
Dogecoin Price Prediction Points to $0.20 Rebound as Coinbase Launches Regulated DOGE Futures
Dogecoin price has gone back to the spotlight as it responds to the growing derivatives…
- Price Analysis
Pi Coin Price Prediction as Expert Warns Bitcoin May Hit $70k After BoJ Rate Hike
Pi Coin price rose by 1.05% today, Dec. 18, mirroring the performance of Bitcoin and…
- Price Analysis
Cardano Price Outlook: Will the NIGHT Token Demand Surge Trigger a Rebound?
Cardano price has entered a decisive phase as NIGHT token liquidity rotation intersects with structural…