Cardano Price Analysis: Hit Three-Month High Near $0.56; Hold or Exit?


The Cardano price analysis implies a bullish overlay for the day. For the week, the bulls have been in action pushing the price from the lows of $0.50 to test three-month highs at $0.56.
A sustained buying pressure drove the ADA upward, reaching a critical resistance zone on the daily chart. Currently, it reads at ADA/USD is exchanging at $0.56, up 3.92% for the day. The trading volume held at a gain of 43% over the intraday session, which is supporting the current price action according to CoinMarketCap data.
- Cardano price edges higher for the second straight day.
- The price is under the formation of a ‘three white soldiers’ bullish pattern.
- The momentum oscillator favors the bullish outlook.
ADA price continues north
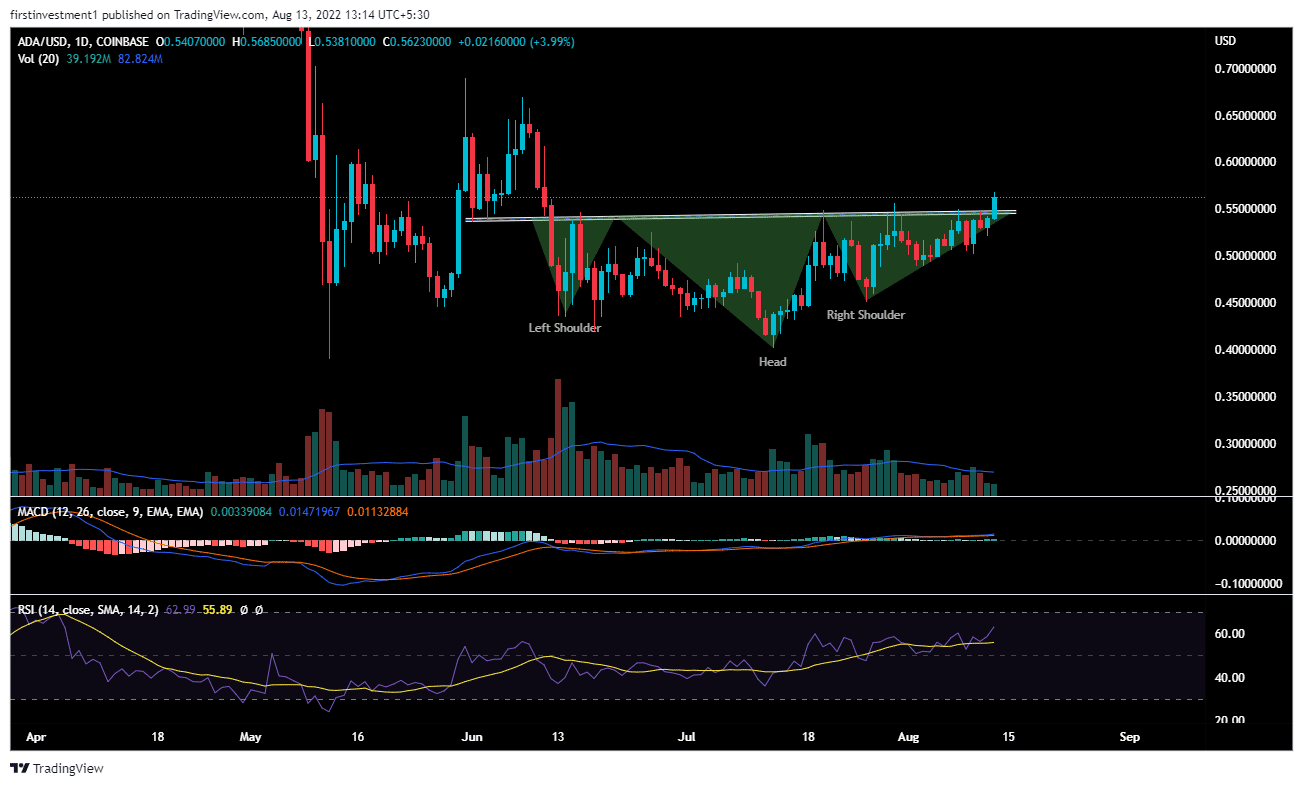
On the daily chart, the Cardano price analysis depicts a strong positive trend.
ADA gave a breakout of an inverted “Head and Shoulder” pattern, which is a bullish reversal formation. However, the breakout is accompanied by below-average volumes, resulting in not a perfectly reliable breakout.
The price was continuously trading in a downtrend for so long. The head and shoulder chart pattern is a reversal pattern. The price crossed above the neckline, & trading above it.
Now, a renewed buying pressure with additional new buyers could result in a good bullish closing above the neckline of the pattern. A “neckline” is drawn by connecting the highest points of the two troughs. According to this pattern, we can expect a good move of up to $0.625.
The RSI (14) is trading above 50. It generally means that the gains are greater than the losses.
Another momentum oscillator, the MACD line crosses above the signal line above zero with rising histograms indicating a continuation of the upside move for now.
On the flip side, a shift in the bearish sentiment could result in testing $0.50 on the lower level.
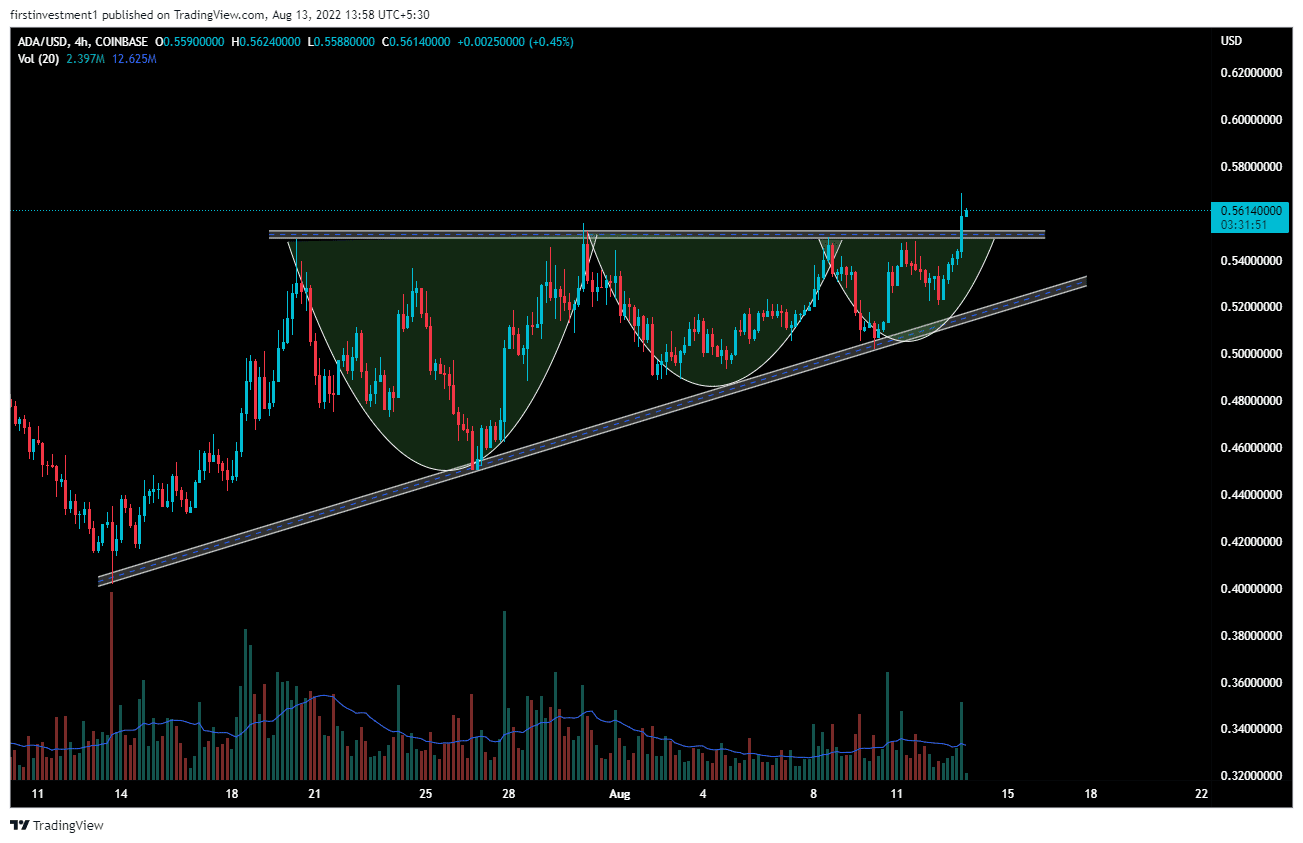
ADA on the four-hour chart gave a breakout of an Ascending Triangle pattern.
Along with a breakout of a Volume contraction pattern. The price needs to sustain above $0.55 on the daily basis, to give a proper confirmation. The volumes were declining when trading in a range, along with the price contraction.
The nearest support is placed around $0.54, whereas the nearest resistance is at $0.625. There is a higher probability of the price sustaining above resistance.
Also read: https://Cardano (ADA) Flips BUSD To Become 7th Largest Crypto, Tests $0.55 Resistance
On the other hand, a break below the $0.54 level could invalidate the bullish outlook. And the price can move below $0.45.
ADA is bullish on all time frames. Above $0.56 closing on the daily time frame, we can put a trade on the buy side.

Why Trust CoinGape
CoinGape has covered the cryptocurrency industry since 2017, aiming to provide informative insights Read more…to our readers. Our journal analysts bring years of experience in market analysis and blockchain technology to ensure factual accuracy and balanced reporting. By following our Editorial Policy, our writers verify every source, fact-check each story, rely on reputable sources, and attribute quotes and media correctly. We also follow a rigorous Review Methodology when evaluating exchanges and tools. From emerging blockchain projects and coin launches to industry events and technical developments, we cover all facets of the digital asset space with unwavering commitment to timely, relevant information.
Related Articles


- BlackRock Bitcoin ETF (IBIT) Options Data Signals Rising Interest in BTC Over Gold Now
- XRP and RLUSD Holders to Access Treasury Yields as Institutional-Grade Products Expand on XRPL
- Prediction Market News: Polymarket to Offer Attention Markets Amid Regulatory Crackdown
- How “Quiet Builders” Are Winning the Web3 Race
- XRP News: Ripple Taps Zand Bank to Boost RLUSD Stablecoin Use in UAE
- Bitcoin Price Analysis Ahead of US NFP Data, Inflation Report, White House Crypto Summit
- Ethereum Price Outlook As Vitalik Dumps ETH While Wall Street Accumulates
- XRP Price Prediction Ahead of White House Meeting That Could Fuel Clarity Act Hopes
- Cardano Price Prediction as Bitcoin Stuggles Around $70k
- Bitcoin Price at Risk of Falling to $60k as Goldman Sachs Issues Major Warning on US Stocks
- Pi Network Price Outlook Ahead of This Week’s 82M Token Unlock: What’s Next for Pi?


