Cardano Price Analysis Today: Is $ADA Price Ready to Reclaim $0.3?
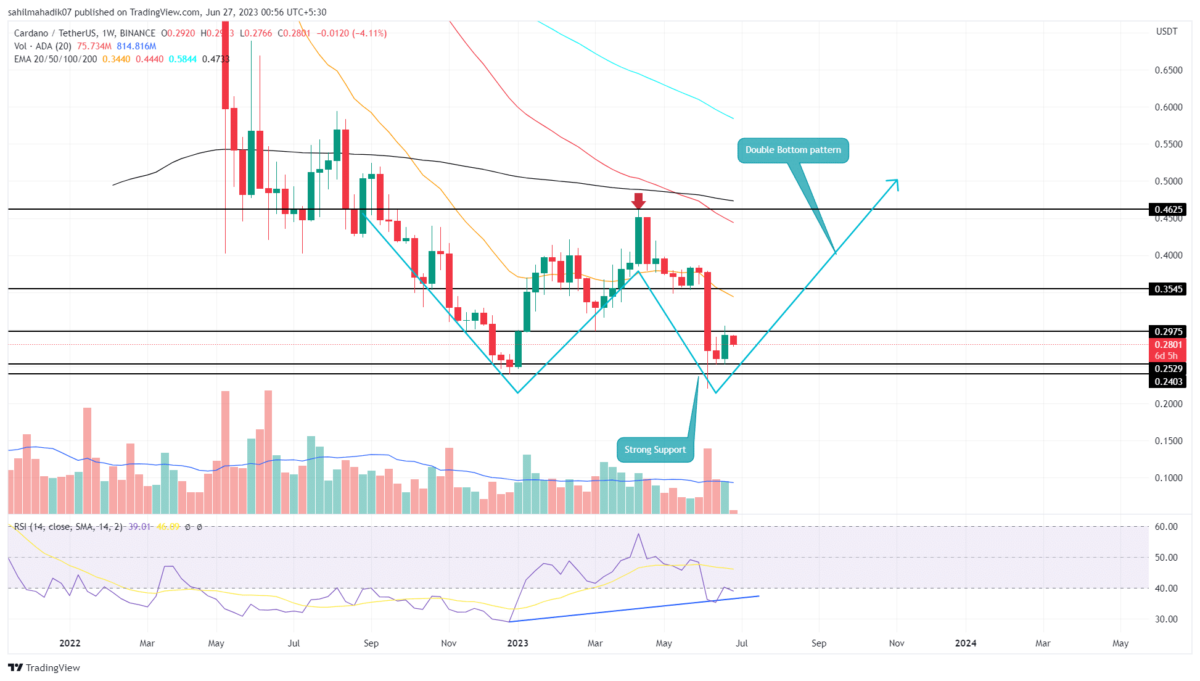
Cardano Price Analysis: Amid the early June Bloodbath, the Cardano coin price found suitable support at the December 2022 bottom support of $0.24. The long-tail rejection at support reflected the strong buying pressure which hints at a higher possibility of a bullish reversal. Using this level as base support, the weekly time frame chart shows the formation of a double bottom pattern.
Also Read: Cardano Founder Points Out Two Key Upgrades, ADA Price Recovers To $0.35?
Cardano Price Daily Chart
- Higher accumulation at $0.24 hints at a potential upswing in the near further.
- A bullish breakout from the $0.3 barrier will set the ADA price for a 20% upswing
- The intraday trading volume in the ADA coin is $188 Million, indicating a 14.5% gain
During last week’s recovery in the crypto market, the Cardano price failed to surpass the immediate horizontal resistance of $0.3. Rejection from this resistance reflects the sellers are still active and the buyers would need higher momentum to reclaim lost ground.
However, the double bottom pattern is a sign of aggressive accumulation from buyers which could trigger a significant upswing. By the press time, the ADA price traders at $0.282 with an intraday loss of 3.3%.
Under the influence of a bullish pattern, the ADA buyers could propel the price higher to challenge the $0.3 psychological barrier. A breakout above this resistance could surge the 20% and bolster the pattern completion.
Is Cardano Price Ready for Trend Change?
A potential breakout from $0.3 will give additional confirmation for a bullish upswing in ADA price. With sustained buying, the coin price should rise 55% to hit the neckline resistance of this double-bottom pattern at $0.462. A breakout above this barrier will offer an early sign of trend reversal.
- Relative Strength Index: Conversely to the same low in price action, the weekly RSI slope shows an evident rise indicator of the bullish momentum for a bullish rally.
- Bollinger Band: The lower band if BB Indiacor challenges the downside indicator the sellers are aggressive at in the current trend
Recent Posts
- Price Analysis
Will Solana Price Hit $150 as Mangocueticals Partners With Cube Group on $100M SOL Treasury?
Solana price remains a focal point as it responds to both institutional alignment and shifting…
- Price Analysis
SUI Price Forecast After Bitwise Filed for SUI ETF With U.S. SEC – Is $3 Next?
SUI price remains positioned at a critical intersection of regulatory positioning and technical structure. Recent…
- Price Analysis
Bitcoin Price Alarming Pattern Points to a Dip to $80k as $2.7b Options Expires Today
Bitcoin price rebounded by 3% today, Dec. 19, reaching a high of $87,960. This rise…
- Price Analysis
Dogecoin Price Prediction Points to $0.20 Rebound as Coinbase Launches Regulated DOGE Futures
Dogecoin price has gone back to the spotlight as it responds to the growing derivatives…
- Price Analysis
Pi Coin Price Prediction as Expert Warns Bitcoin May Hit $70k After BoJ Rate Hike
Pi Coin price rose by 1.05% today, Dec. 18, mirroring the performance of Bitcoin and…
- Price Analysis
Cardano Price Outlook: Will the NIGHT Token Demand Surge Trigger a Rebound?
Cardano price has entered a decisive phase as NIGHT token liquidity rotation intersects with structural…