Cardano Price Analysis: What’s Ahead for $ADA Price after $0.3 Breakout?


Cardano Price Analysis: The recent upsurge in the pioneer cryptocurrency bitcoin created a sense of recovery rally in the major altcoins. Thus, the seven largest crypto coin, Cardano managed to hold the $0.25 support and showed an upswing in the daily time frame chart. The bullish reversal surged the prices 17.6% up to hit the psychological barrier of $0.3; is ADA price ready for further growth or another correction is just around the corner?
Also Read: Cardano Founder Points Out Two Key Upgrades, ADA Price Recovers To $0.35?
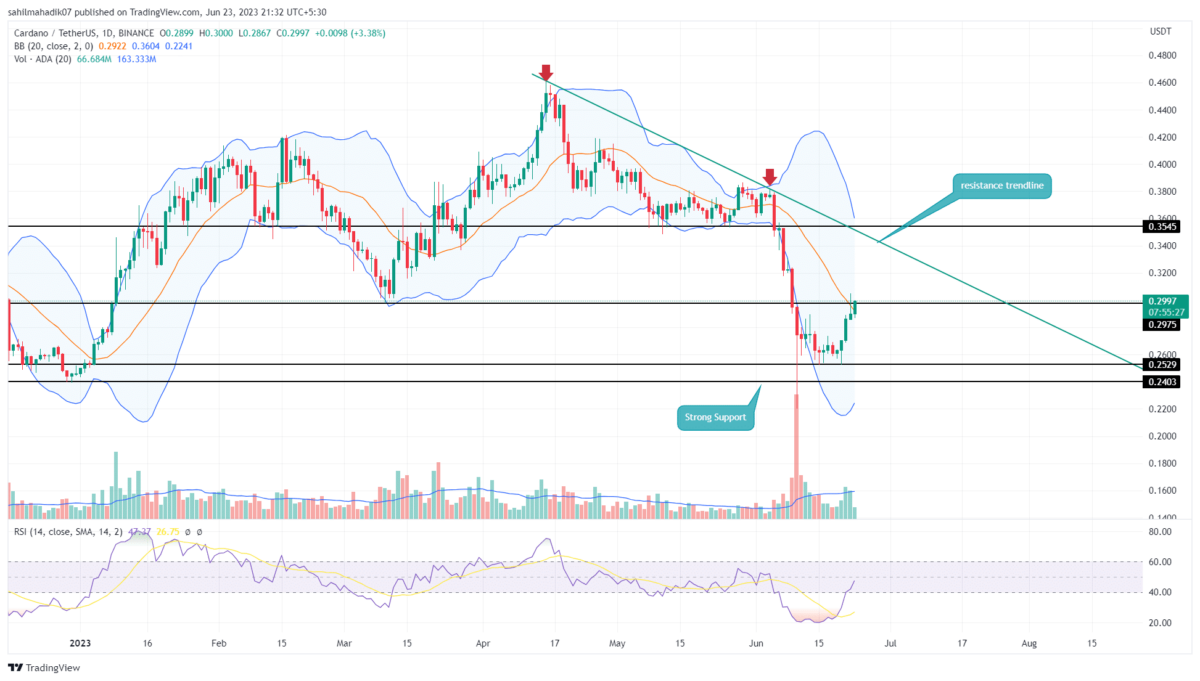
Cardano Price Daily Chart: https://coingape.com/price/cardano/#:~:text=About%20Cardano%20(ADA),trading%20volume%20
- The coin sellers aggressively defend the $0.3 resistance.
- A downsloping trendline represents the current downtrend in the ADA price
- The intraday trading volume in the ADA coin is $191.2 Million, indicating a 50% gain
 Source- Tradingview
By the press time, the Cardano coin price trades at $0.29 and wavers below the $0.3 barrier. The higher price rejection candle at $0.3 reflects the sellers are active at this ceiling and could undermine the buyers’ attempt to rise higher.
However, the ongoing recovery in ADA is more likely initiated by the accumulation of investors seeking discount prices and the improved market sentiment due to Bitcoin’s rise. Therefore, the potential buyers must wait for a better confirmation to reflect the sustainability of buyers at higher prices.
If the supply pressure at $0.3 rises, the Cardano coin could witness a bearish reversal to retest the $0.256 support.
Is Cardano Price Ready for Bullish Recovery?
In case, the ADA price manages to breach the $0.3 resistance with a daily candle closing. above. The coin price could rise 12% and face immediate resistance from the downsloping trendline. This dynamic resistance has restricted bullish growth for over two months and therefore, its breakout will be the key signal for trend reversal.
Relative Strength Index: The daily RSI slope rises above the 40% slope reflecting the improvement in bullish momentum that can support a significant recovery.
Bollinger Band: The midline of the Bollinger Band indicator offers an additional barrier against buyers at $0.3.

Why Trust CoinGape
CoinGape has covered the cryptocurrency industry since 2017, aiming to provide informative insights Read more…to our readers. Our journal analysts bring years of experience in market analysis and blockchain technology to ensure factual accuracy and balanced reporting. By following our Editorial Policy, our writers verify every source, fact-check each story, rely on reputable sources, and attribute quotes and media correctly. We also follow a rigorous Review Methodology when evaluating exchanges and tools. From emerging blockchain projects and coin launches to industry events and technical developments, we cover all facets of the digital asset space with unwavering commitment to timely, relevant information.


