Chainlink Price Analysis: LINK Bulls defended $13.5 Support; Can They Break $16.75?


Due to a huge correction in the last two weeks, LINK price lost around 50% in value. The LINK/USD pair has dropped to the crucial support of $13.5 looking for sufficient demand. The coin chart shows several lower price rejection candles at the bottom support registering a 20% gain in the last six days. If the buyers could sustain this momentum, the coin could enter a recovery phase above $16.75.
Key technical points:
- LINK token technical chart shows a bearish crossover of the 100-and-200-day SMA
- The intraday trading volume in the LINK token is $791.5 Billion, indicating a 9.31% fall.
 Source- Tradingview
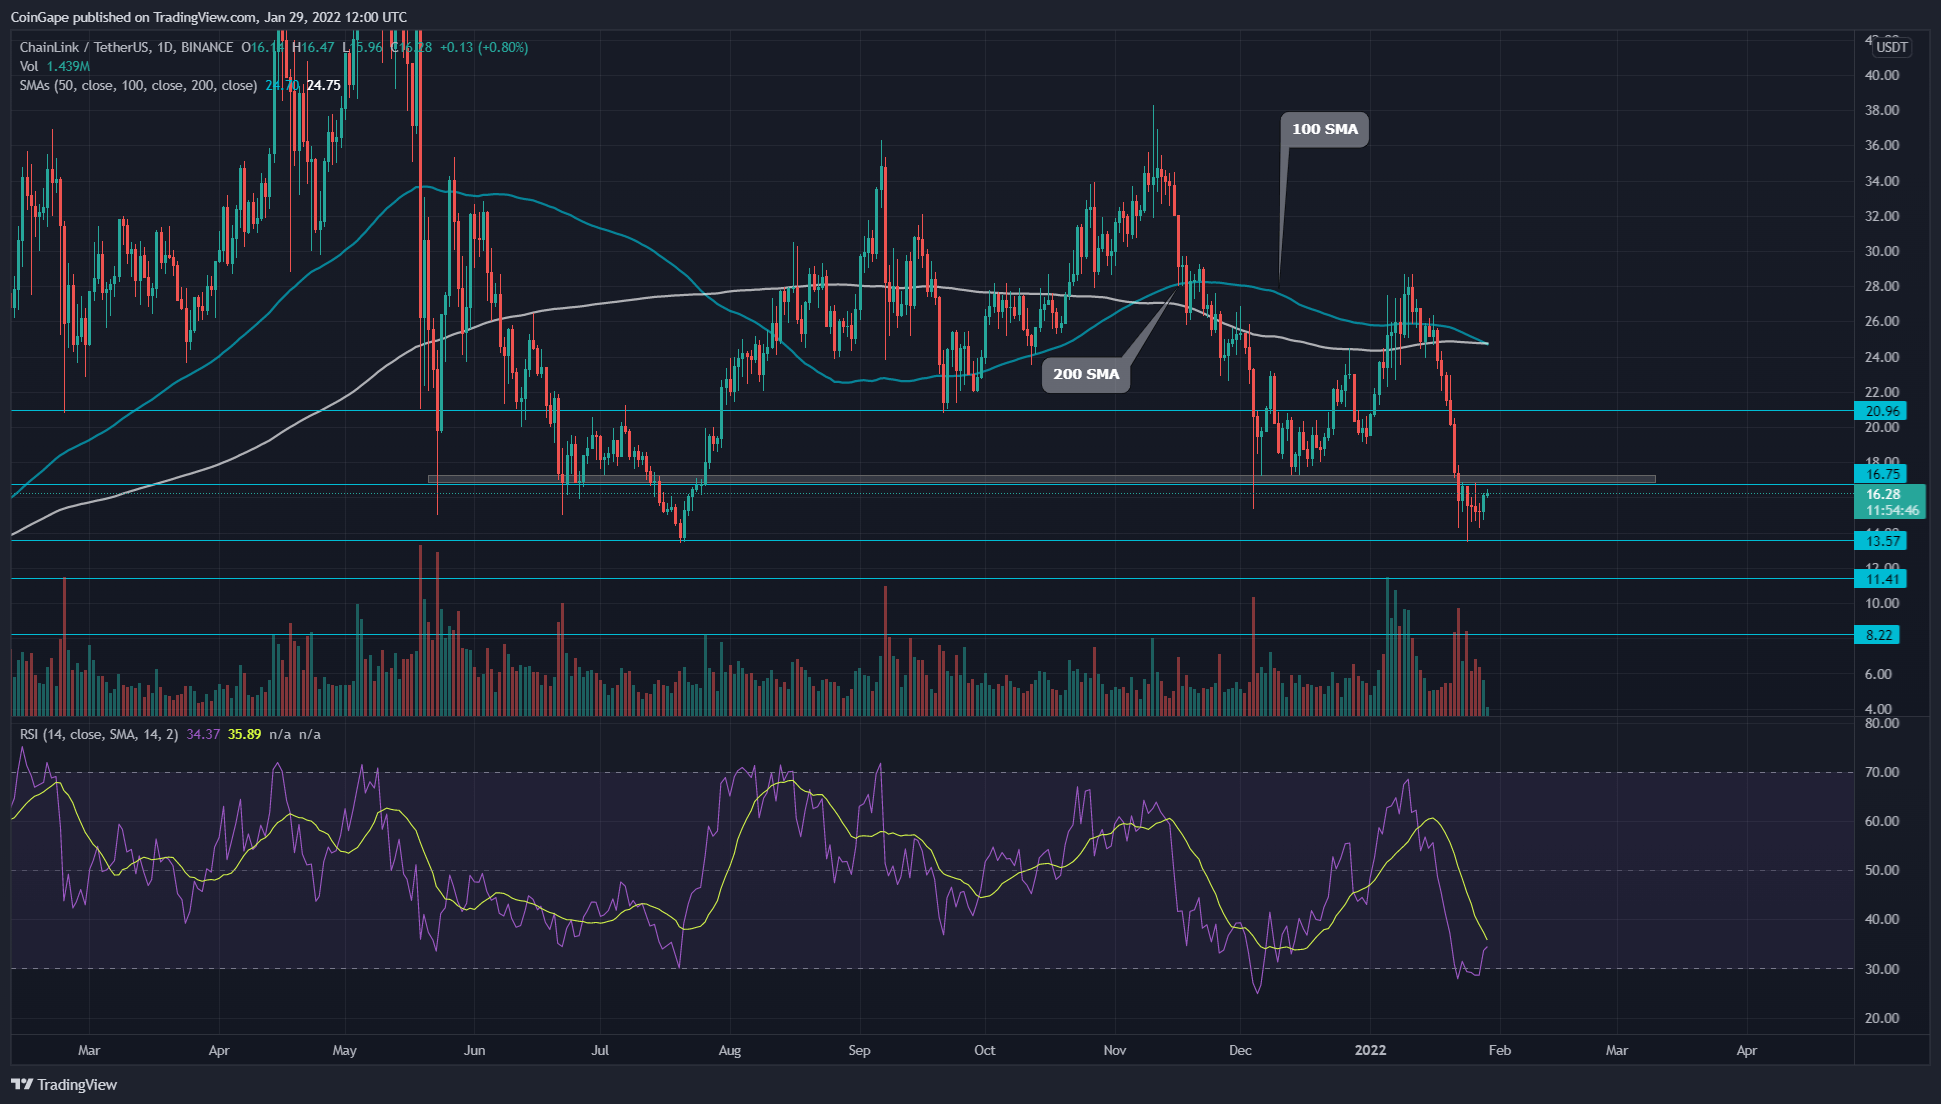
In our last coverage of Chainlink technical analysis, Coingape warned about a further drop in LINK/USD pair as this coin sinks below the $20 floor. Under the influence of the crypto bloodbath, the seller engulfed another floor support of $16.75 and dropped the coin to yearly support of $13.57.
- The LINK price has been discounted by 50% from the previous swing high of $28.5. The token buyers show strong interest in the current market value($16.28), displaying long lower price rejection in the technical chart.
- The daily-Relative Strength index(34) recovered from the oversold region challenges the 14-SMA line. However, more buying pressure would be required for successful crossover above the midline.
- This recent sell-off has triggered a bearish crossover of the 100 and 200 SMA, encouraging the seller to continue the bear attack.
Recovery Rally Needs $16.75 Breakout
 Source-Tradingview
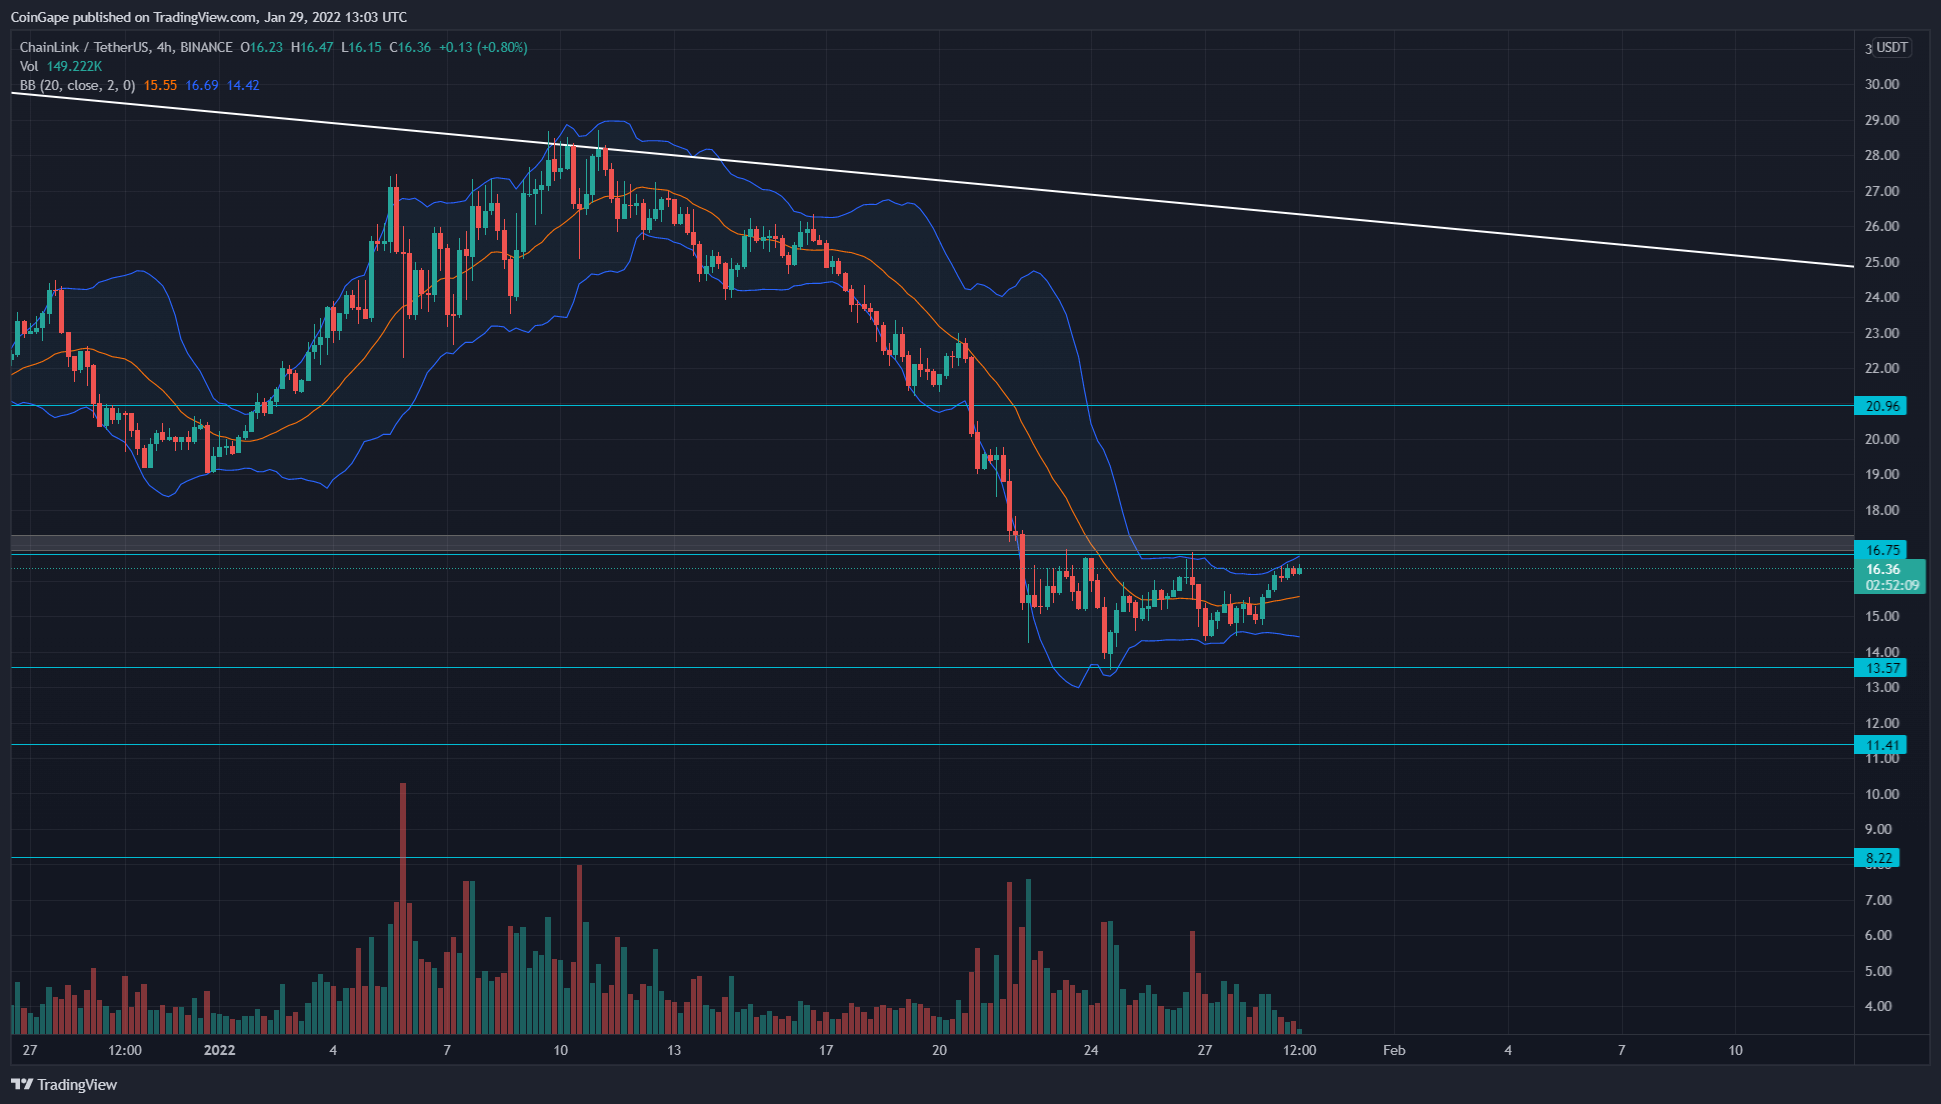
This week the LINK price action showed a whipsaw movement between the $16.75 and $13.57. Such minor consolidation avails a recovery opportunity for buyers once the coin pump above the overhead resistance.
However, the downside risks are substantial as a shift sell-off could violate the bottom support of $13.57, leading to further downsizing.
Bollinger band indicator moving sideways completely engulfs this week’s price action. The token price moving higher to the middle line aims to retest the $16.75 resistance.
- Resistance levels- $16.75, $21
- Support levels are $13.57 and $11.5.

Why Trust CoinGape
CoinGape has covered the cryptocurrency industry since 2017, aiming to provide informative insights Read more…to our readers. Our journal analysts bring years of experience in market analysis and blockchain technology to ensure factual accuracy and balanced reporting. By following our Editorial Policy, our writers verify every source, fact-check each story, rely on reputable sources, and attribute quotes and media correctly. We also follow a rigorous Review Methodology when evaluating exchanges and tools. From emerging blockchain projects and coin launches to industry events and technical developments, we cover all facets of the digital asset space with unwavering commitment to timely, relevant information.
Related Articles


- Trump Backed Rick Rieder Now Leads the Odds for New Fed Chair
- Trump Threatens 100% Canada Tariffs as Bitcoin Holds $89K
- Is a Bitcoin Bull Run Possible in 2026? Here’s Why Arthur Hayes Thinks Yes
- Trump’s World Liberty Bank Charter Advances as OCC Rejects Senator Warren Criticism
- Gemini Lawsuit Dismissed: SEC Drops Case After Full Investor Recovery
- PEPE vs PENGUIN: Can Pengu Price Outperform Pepe Coin in 2026?
- Binance Coin Price Outlook As Grayscale Files S-1 for BNB
- Solana Price Prediction as SOL ETF Inflows Outpace BTC and ETH Together
- Bitcoin and Gold Outlook 2026: Warsh, Rieder Gain Traction in Trump’s Fed Pick
- PEPE Coin Price Eyes 45% Rebound as Buyers Regain Control on Spot Markets
- Pi Network Price Prediction: Will PI Coin Hold Steady at $0.18 Retrace Lower?


