Chainlink Price Prediction as Whales Buy 800K LINK — Can the Demand Zone Launch a Recovery?


Highlights
- Chainlink price trades at $21.81, consolidating within demand zone after multiple retests.
- LINK price outlook strengthened by bullish pennant flag and whale accumulation signals.
- Negative netflows highlight reduced exchange supply, reinforcing long-term confidence.
Chainlink price sits at a critical level as charts highlight a bullish setup within the demand zone. The pattern points to potential rebounds if support holds firm. Meanwhile, whale accumulation during the recent dip suggests growing confidence in LINK price. Together, these factors highlight conditions for a possible breakout.
Bullish Pennant and Demand Zone Signal Possible LINK Price Rally
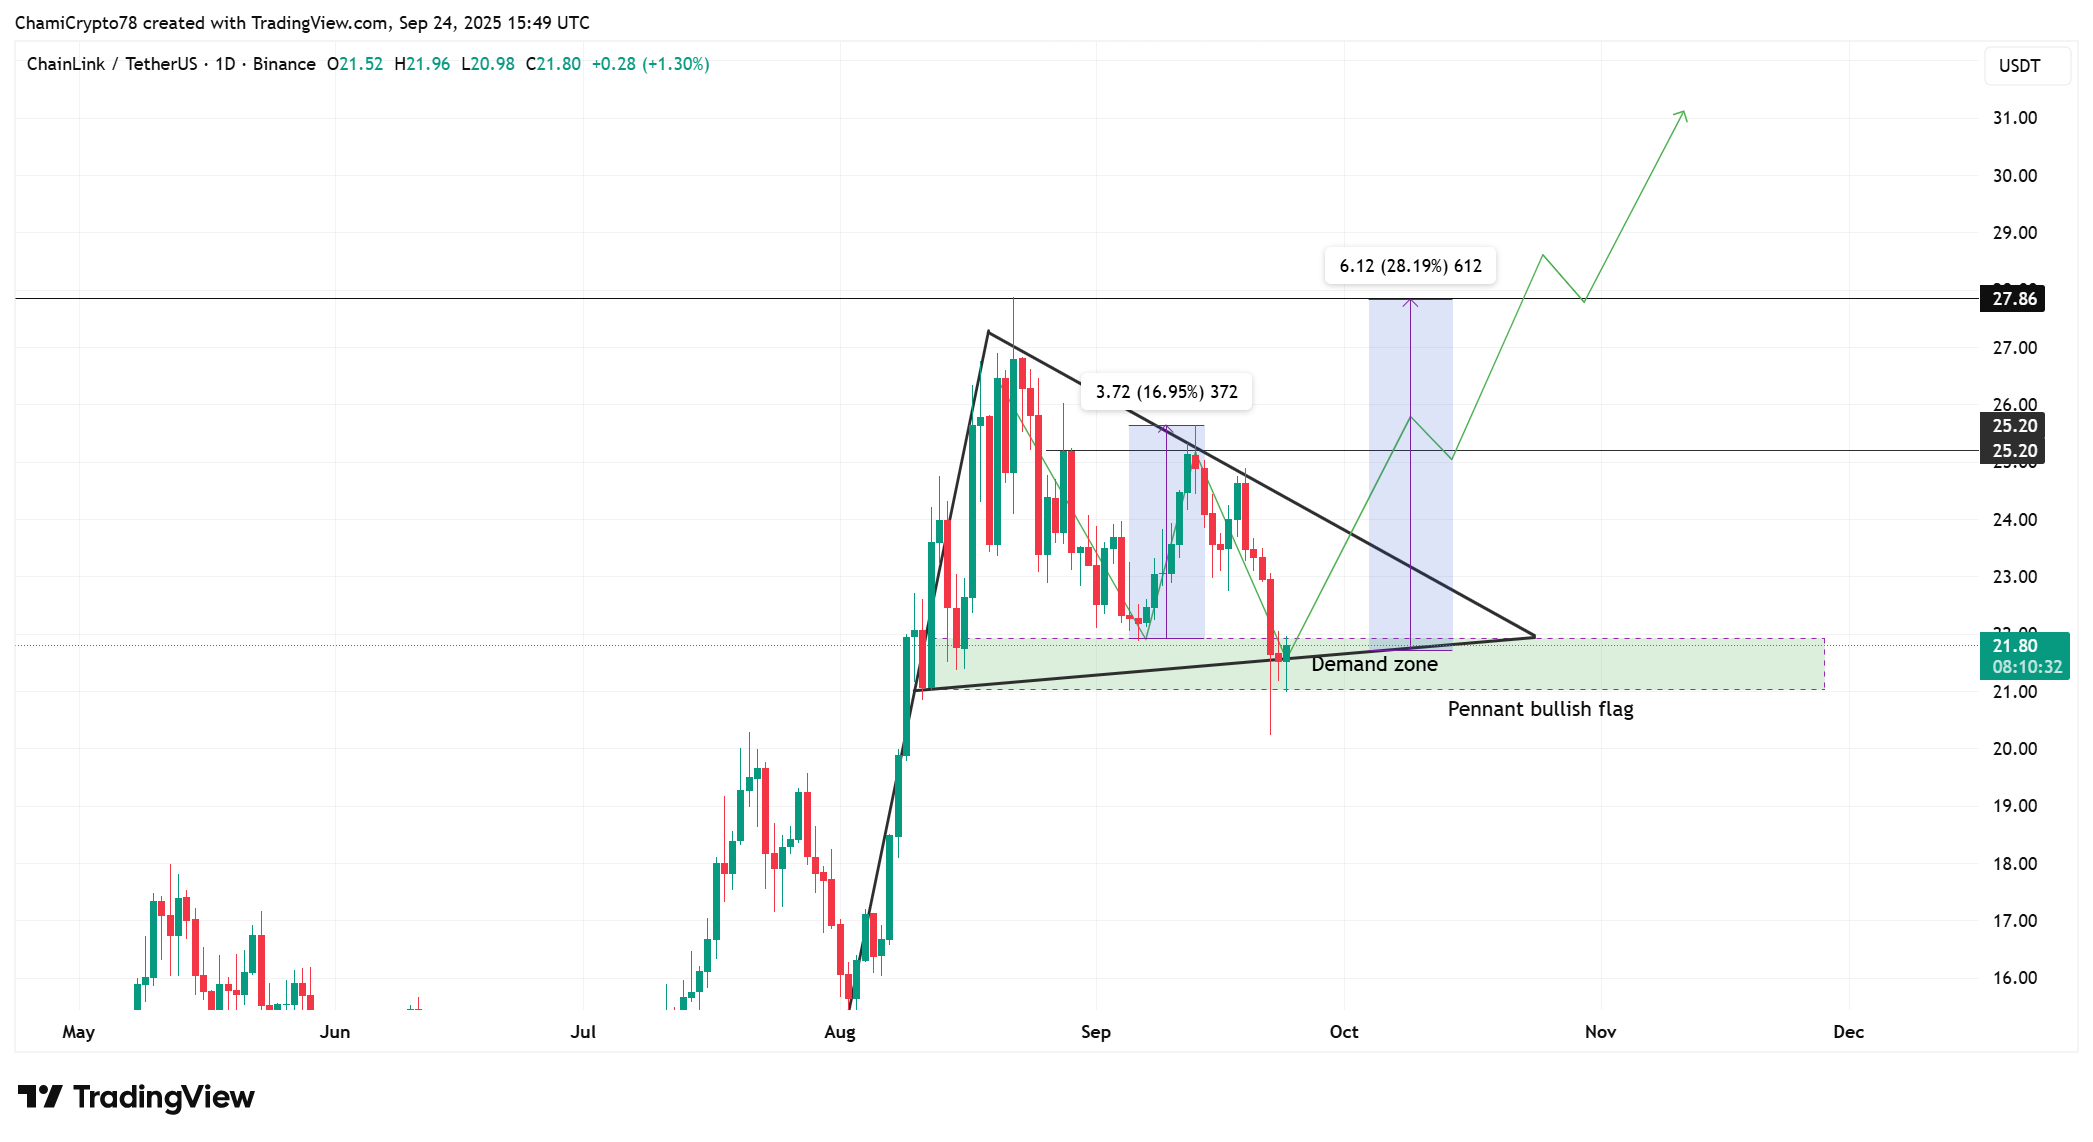
The current LINK market price trades at $21.81 after consolidating within the demand zone. A double bottom structure has emerged, with the first bottom formed on September 2 near $21 and the second confirmed on September 6.
After this retest, LINK price staged a 17% rally toward $25.6 before pulling back again. Specifically, the chart highlights a bullish pennant flag, a continuation structure that strengthens the rebound case.
Notably, a break above resistance at $25.20 could unlock a 28% rally toward $27.86. Meanwhile, defending the demand zone remains vital to prevent downside pressure from resurfacing.
Importantly, a confirmed extension beyond $27.86 would validate the pennant projection, with room toward $30. Therefore, the long-term Chainlink price prediction maintains an optimistic bias as patterns reinforce buyer strength.
Chainlink Confidence Builds as Whales Accumulate and Supply Declines
Whales added over 800,000 LINK during the recent dip, signaling confidence at lower levels, according to Ali Charts on X platform. This accumulation reflects renewed interest in long-term positioning within the demand zone. Such activity often precedes price recoveries as larger holders seek strategic entries.
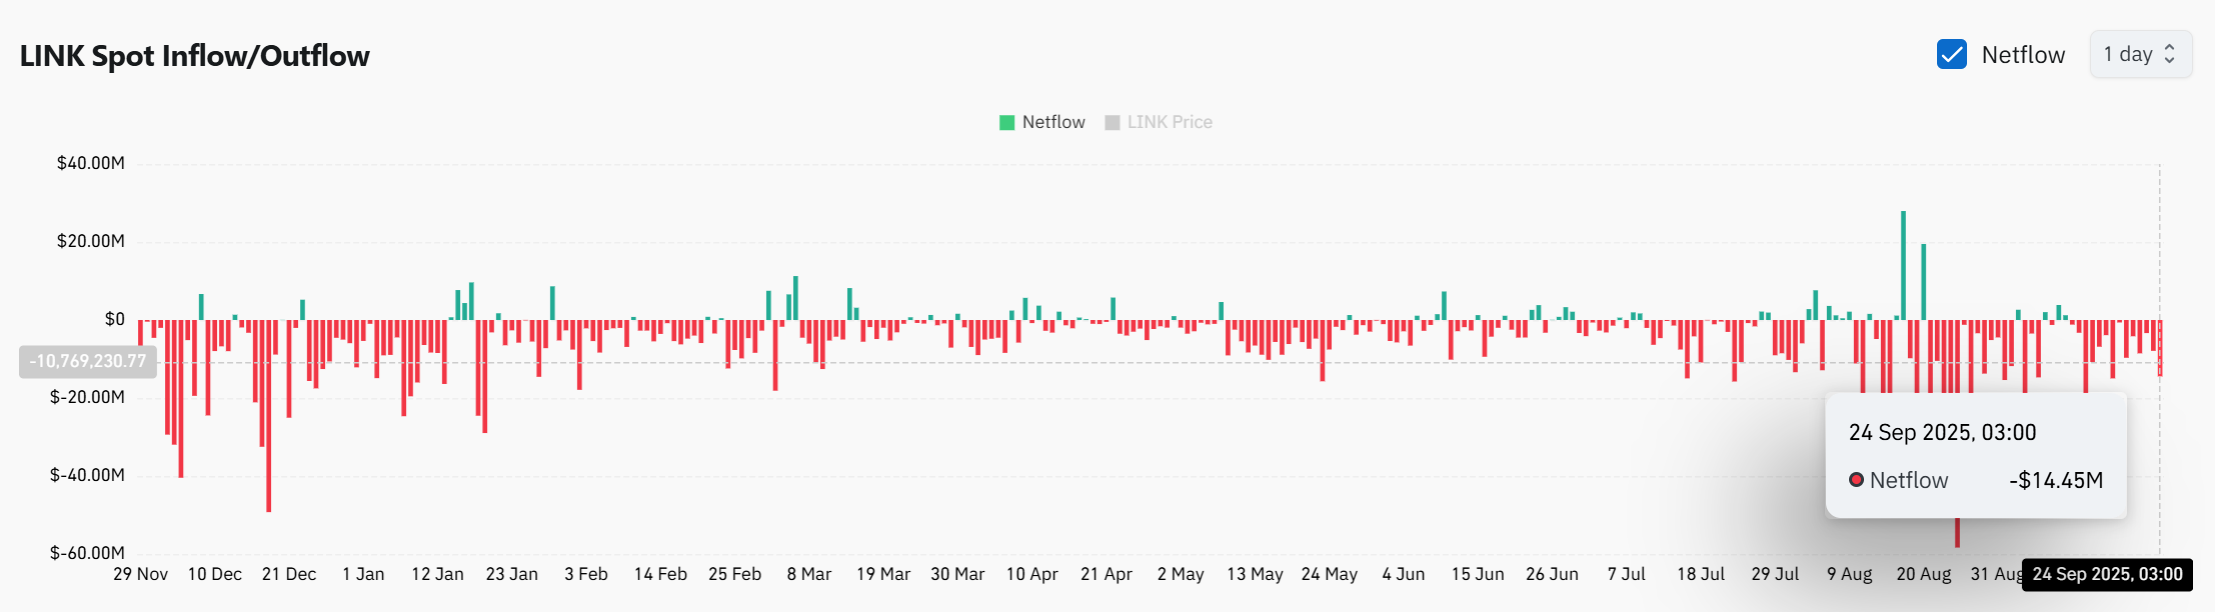
Netflow data also supports this narrative, with outflows showing $14.45M on September 24, according to CoinGlass. Consistent negative netflows indicate coins leaving exchanges, reducing available supply for immediate selling.
Meanwhile, fewer inflows highlight that selling pressure remains limited despite short-term volatility. Together, these metrics suggest strong accumulation aligning with technical support levels.
Ultimately, Chainlink price shows signs of resilience after repeated defense of its demand zone. LINK price benefits from both technical setups and strong whale participation. Netflows further reinforce optimism by signaling reduced supply pressure. Therefore, conditions align in support of a breakout cycle ahead.
Frequently Asked Questions (FAQs)
1. What chart pattern is forming on Chainlink?
2. How are whales influencing Chainlink’s market structure?
3. What does negative netflow indicate for LINK?

Why Trust CoinGape
CoinGape has covered the cryptocurrency industry since 2017, aiming to provide informative insights Read more…to our readers. Our journal analysts bring years of experience in market analysis and blockchain technology to ensure factual accuracy and balanced reporting. By following our Editorial Policy, our writers verify every source, fact-check each story, rely on reputable sources, and attribute quotes and media correctly. We also follow a rigorous Review Methodology when evaluating exchanges and tools. From emerging blockchain projects and coin launches to industry events and technical developments, we cover all facets of the digital asset space with unwavering commitment to timely, relevant information.

Related Articles


- Michael Saylor Hints at Another Strategy BTC Buy as Bitcoin Drops Below $68K
- Expert Says Bitcoin Now in ‘Stage 4’ Bear Market Phase, Warns BTC May Hit 35K to 45K Zone
- Bitcoin Price Today As Bulls Defend $65K–$66K Zone Amid Geopolitics and Tariffs Tensions
- XRP Realized Losses Spike to Highest Level Since 2022, Will Price Rally Again?
- Crypto Market Rises as U.S. and Iran Reach Key Agreement On Nuclear Talks
- Shiba Inu Price Feb 2026: Will SHIB Rise Soon?
- Pi Network Price Prediction: How High Can Pi Coin Go?
- Dogecoin Price Prediction Feb 2026: Will DOGE Break $0.20 This month?
- XRP Price Prediction As SBI Introduces Tokenized Bonds With Crypto Rewards
- Ethereum Price Rises After SCOTUS Ruling: Here’s Why a Drop to $1,500 is Possible
- Will Pi Network Price See a Surge After the Mainnet Launch Anniversary?


