Coinbase Price Prediction: Will $COIN Price Reclaim $70 Mark in June


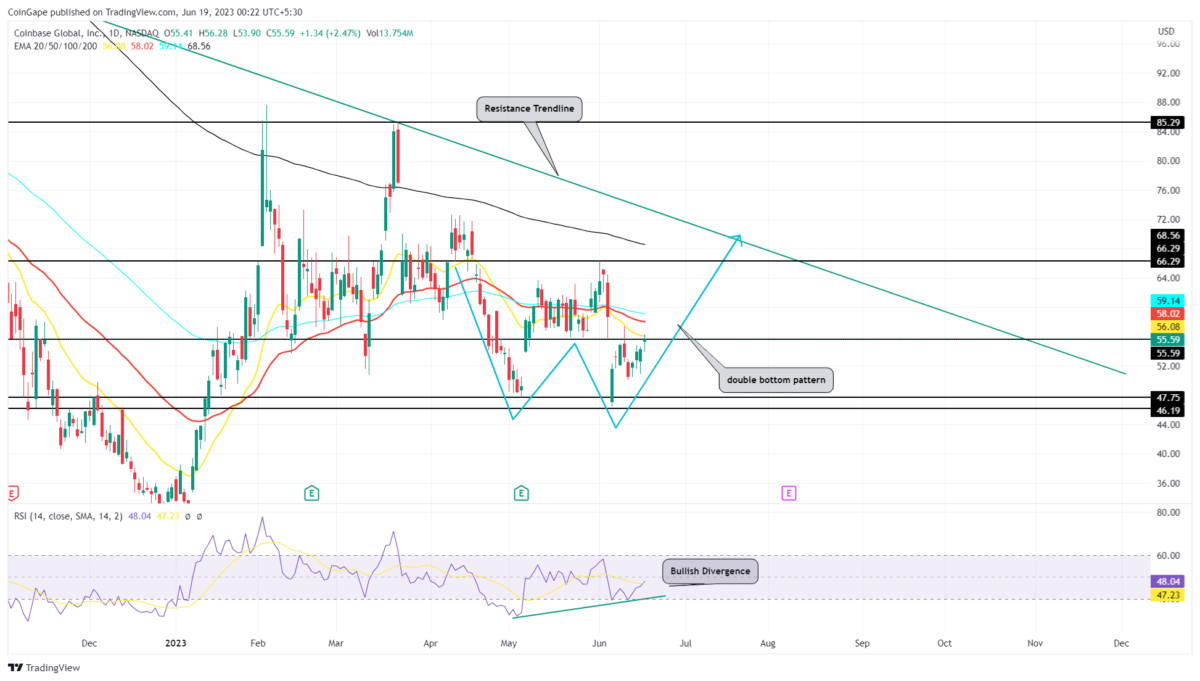
Coinbase Price Prediction: After a massive gap in the share price of Coinbase(COIN) on June 6th, the buyers found immediate support at $47.75-$46.2. The coin price showed a quick rebound of 17.4% and hit the local resistance of $55.6. Using the aforementioned level as base support, the COIN price shows the formation of a double bottom pattern in the daily time frame chart. Can this bullish pattern bolster market buyers to regain trend control?
Also Read: SEC Lawsuit Impact: BinanceUS Fires Staff, Coinbase Losing Market Share to Robinhood
Coinbase Price Daily Chart:
- The formation of the double bottom pattern is a sign of potential recovery and trend reversal.
- A bullish divergence in the daily RSI slope reflects increasing buying pressure
- A long-coming resistance trendline could invalidate the bullish thesis
 Source-Tradingview
The formation of a double bottom pattern is a sign of aggressive accumulation of buyers at a particular support. This setup is one of the famous bullish reversal patterns which offers a significant upswing upon the breakout of its neckline resistance.
By the press time, the COIN Price trades at $55.59 and struggles to breach the overhead resistance of $55.6. Under the influence of this pattern, the price is likely to rise another 18.5% to challenge the $66.3 neckline.
A bullish breakout above $66.3 with daily candle closing must trigger the bullish pattern. The post-breakout rally could push the Coinbase share price to the $85.3 mark.
Will the $COIN Price Regain the $70 mark?
In response to the double bottom pattern, the Coinbase share price is likely to witness gradual growth in the near future. However, the potential rally could face multiple resistance such as $55.6 and daily EMAs(20, 50, and 100) before hitting the key neckline resistance of $55.6. An upside breakout from this resistance will pave the way for further growth and push the prices to the $66 mark.
- Relative Strength: The rising RSI slope against the sideways price action gives an excellent confirmation of rising bullish momentum for a potential rally.
- Exponential Moving Average: the 20, 50, and 100 EMAs wavering just above the $66.3 barrier indicates the buyers will face multiple resistance on the upside.
Why Trust CoinGape
CoinGape has covered the cryptocurrency industry since 2017, aiming to provide informative insights Read more…to our readers. Our journal analysts bring years of experience in market analysis and blockchain technology to ensure factual accuracy and balanced reporting. By following our Editorial Policy, our writers verify every source, fact-check each story, rely on reputable sources, and attribute quotes and media correctly. We also follow a rigorous Review Methodology when evaluating exchanges and tools. From emerging blockchain projects and coin launches to industry events and technical developments, we cover all facets of the digital asset space with unwavering commitment to timely, relevant information.
Related Articles


- Trump To Name Next Fed Chair Next Week as Pro-Crypto Chris Waller Gains Momentum
- BTC Price Crashes Below $85K Amid U.S.-Iran Tensions and Hawkish Fed Pivot
- Breaking: CLARITY Act Advances as Senate Ag. Committee Votes In Favor Of Crypto Bill
- NOWPayments Review 2026 : Features, Fees & Is It Worth It?
- Atkins Backs Crypto in 401(k)s as SEC and CFTC Hold Regulation Harmonization Roundtable
- Ethereum and XRP Price Prediction as Odds of Trump Attack on Iran Rise
- Gold and S&P 500 Price Prediction as BTC $88K Sparks Global Risk-On Rally
- How High Can Hyperliquid Price Go in Feb 2026?
- Top Meme Coins Price Prediction: Dogecoin, Shiba Inu, Pepe, and Pump. Fun as Crypto Market Recovers.
- Solana Price Targets $200 as $152B WisdomTree Joins the Ecosystem
- XRP Price Prediction After Ripple Treasury launch


