 Buy $GGs
Coinbase Stock Price Soars 142% in Five Weeks: Is this Rally Sustainable?


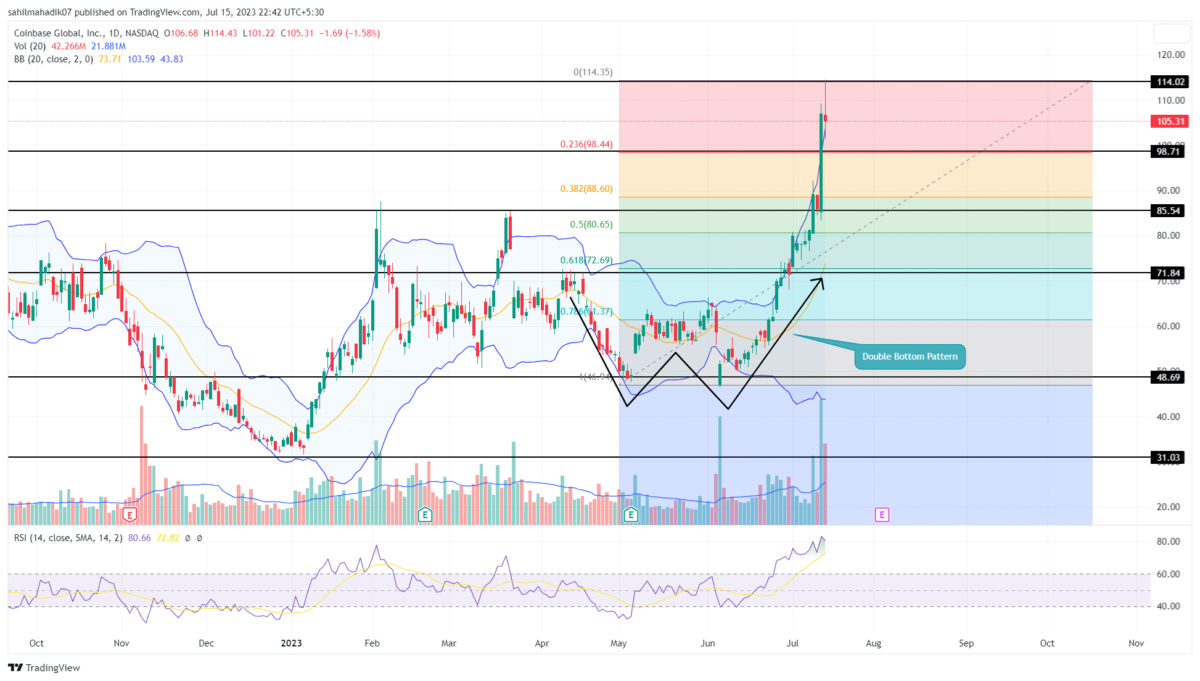
The Coinbase stock price has experienced an incredible surge over the past five weeks, displaying parabolic growth in the daily time chart. Starting from June 6th low of $46.3, the coin’s value has skyrocketed to its current price of $114, representing an astounding growth of 142%. This bullish rally can be attributed to the development of a bullish reversal pattern called double bottom and the ripple effect caused by the recent surge in the 5th largest cryptocurrency-XRP. Can buyers continue this rally longer or is it time for sellers to enter?
Also Read: Coinbase Stock Defies Lawsuit And Crypto Winter; $COIN Price Shoots By 16%
Coinbase Price Daily Chart
- Profit booking from short-term investors could trigger a minor correction in the COIN price
- The potential pullback could witness strong support at the $100 psychological mark
- A potential golden crossover between the 50-and-200-day EMAs could bolster the buying pressure
 Source-Tradingview
Amid the recent rally, the Coinbase stock price reclaimed some crucial chart levels such as $71.8, $85.5, and $98.7. The bull rally back by increased volume indicates buyers’ conviction to lead sustained growth.
However, it seems, the COIN price has already witnessed a significant rally in a short period and any further growth is likely until some new positive news has spread. By the press time, the stock price trades at the $105 mark, and the long-rejection wicks attached to the daily reflect the overhead supply pressure.
This rejection indicates this asset may witness a post-rally correction to replenish the exhausted bullish. At such time, the reclaimed level mentioned above could act as suitable support to restart a bullish recovery.
How Far Can the COIN Price Correct?
With a high selling pressure present at $114, the Coinbase stock price is poised for a minor retracement. As per the Fibonacci retracement level, the $100-98.7 support aligned with the 23.6% FIB level stands on solid footing to sustain higher prices. In case of a longer correction, the stockholders can expect demand pressure at $88.45(38.2% FIB), followed by $80(50% FIB).
- Bollinger band: The COIN price challenging the upper ceiling of the Bollinger band indicator, suggests the bullish momentum is aggressive.
- Relative Strength Index: The daily RSI slope entering the overbought region indicates the requirement of a minor correction.
Play 10,000+ Casino Games at BC Game with Ease
- Instant Deposits And Withdrawals
- Crypto Casino And Sports Betting
- Exclusive Bonuses And Rewards


Why Trust CoinGape
CoinGape has covered the cryptocurrency industry since 2017, aiming to provide informative insights Read more…to our readers. Our journal analysts bring years of experience in market analysis and blockchain technology to ensure factual accuracy and balanced reporting. By following our Editorial Policy, our writers verify every source, fact-check each story, rely on reputable sources, and attribute quotes and media correctly. We also follow a rigorous Review Methodology when evaluating exchanges and tools. From emerging blockchain projects and coin launches to industry events and technical developments, we cover all facets of the digital asset space with unwavering commitment to timely, relevant information.

Related Articles


- XRP Price Dips on US-Iran Conflict, But Capitulation Signals March Rebound
- Crypto Market at Risk as U.S.–Iran War Threatens Inflation With Oil Price Surge
- Polymarket U.S.–Iran Strike Bets Fuel Insider Trading Speculation as Crypto Traders Net $1.2M
- Cardano’s DeFi TVL Climbs as USDCx Stablecoin Launches on Network
- Gold vs. Bitcoin: Can Gold Outperform BTC Amid US–Iran Conflict?
- Top Analyst Predicts Pi Network Price Bottom, Flags Key Catalysts
- Will Ethereum Price Hold $1,900 Level After Five Weeks of $563M ETF Selling?
- Top 2 Price Predictions Ethereum and Solana Ahead of March 1 Clarity Act Stablecoin Deadline
- Pi Network Price Prediction Ahead of Protocol Upgrades Deadline on March 1
- XRP Price Outlook As Jane Street Lawsuit Sparks Shift in Morning Sell-Off Trend
- Dogecoin, Cardano, and Chainlink Price Prediction As Crypto Market Rebounds


