Decentraland Price Analysis: Consolidates Below $0.85; Is Time To Buy?


The Decentraland price analysis shows familiar sideways movement on Thursday. The price consolidates in a very tight range for the past few sessions. The recent price action is the result of the intense selling MANA faced on August 19. MANA price is trading with no clear directional bias.
As of publication time, MANA/USD is reading at $0.82, down 0.55% for the day. The 11th-largest cryptocurrency by the market cap holds the 24-hour trading volume down 2% at $2.90 billion.
- Decentraland price consolidates for the sixth straight session on Thursday.
- A breakdown of the rising channel indicates the overall bearish sentiment.
- A daily candlestick below $0.81 would strengthen the bearish outlook.
Decentaland Price is in limbo looking for a clear directional setup
MANA price trades at $0.82, 81% below the year 2022 high around $3.55. After testing the high, the price has been trading in a descending channel.
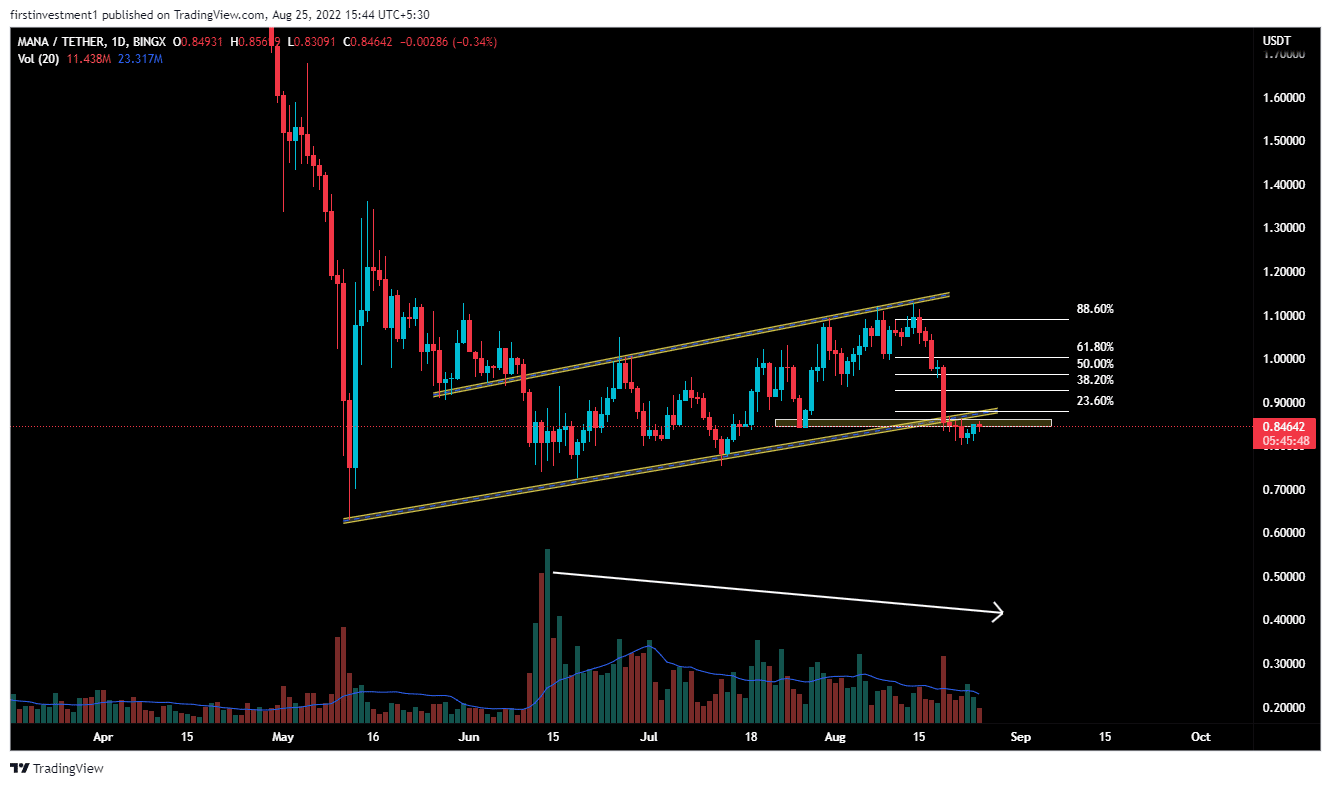
On the daily chart, MANA gave a breakdown of the “Rising Channel” pattern, which extends from the lows of $0.59 made on May 12. However, the price broke the lower trend line on August 21.
An impulse fall was witnessed in the price from the resistance with a nearly 25% loss. MANA breakdown its previous swing low, making lower lows on the daily chart. The volumes were declining, with the rising price of a MANA, which implied a concern for the bulls. When the market is rising while volume is declining, big money is not the one buying, more likely slowly exiting positions.
There is a higher probability of price giving a pullback, before giving any sharp fall again in the coming future. We can expect a pullback between 38.2% ($0.926) to 50% ($0.9685). Fibonacci retracement levels. The “Buy on Selling” opportunity is the best course of plan to go with.
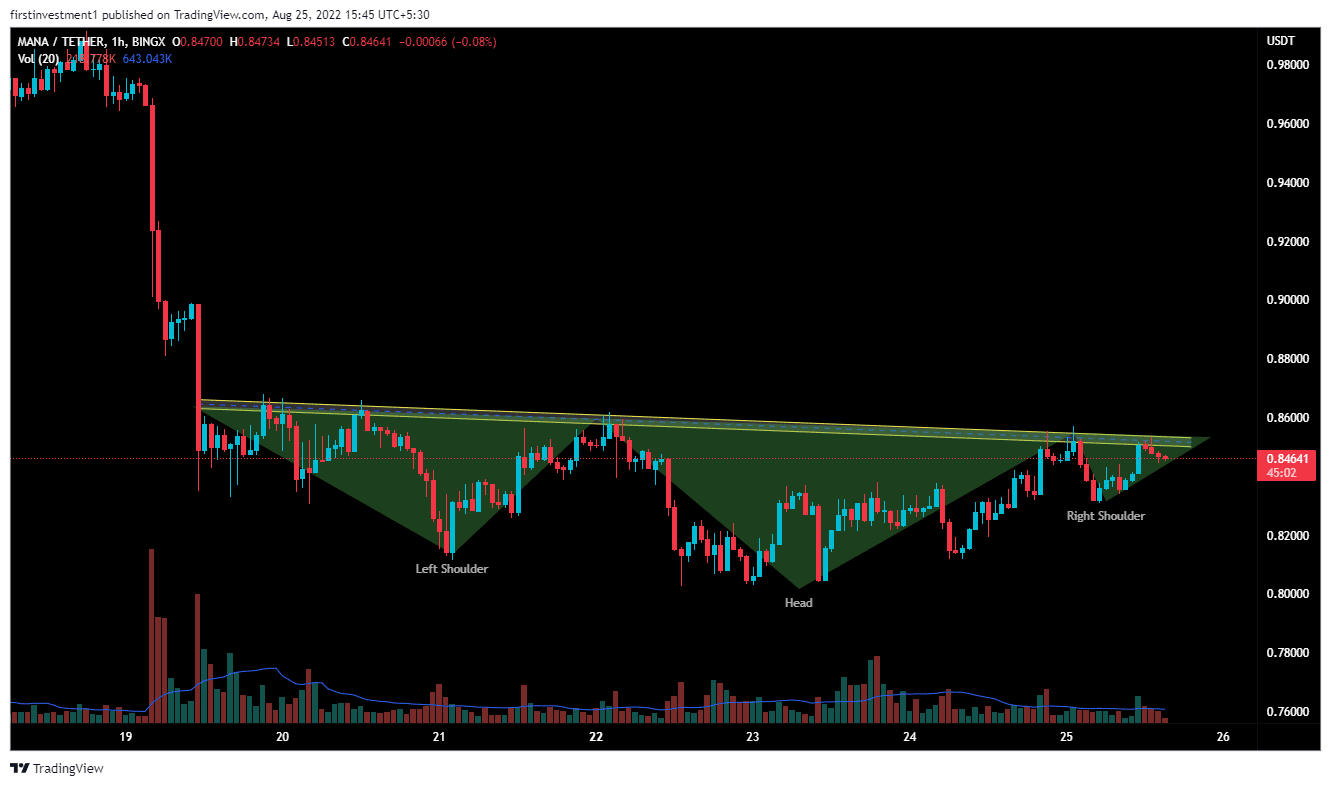
MANA on the hourly chart formed a bullish “Head & Shoulder” pattern.
Now, if the price gave a closing above $0.85 on the hourly chart amid sustained buying, we can expect a bullish momentum up to the pullback levels, mentioned above.
The nearest support is the swing low, which is $0.82, and the nearest resistance is at $0.85. There is a higher probability of the price breaking the upper level on a lower level.
Also read: https://This Crypto Company Plans To Go Public Amid Bear Market
The formation of several Doji candlesticks suggests indicates consolidation near the lower level. A decisive break above the $0.85 level would bring gains in the coin. Further, the bulls would aim for $1.03
XTZ is sideways on all time frames. A spike in buy order could push the price to a higher level, we’ll put a buy trade.

Why Trust CoinGape
CoinGape has covered the cryptocurrency industry since 2017, aiming to provide informative insights Read more…to our readers. Our journal analysts bring years of experience in market analysis and blockchain technology to ensure factual accuracy and balanced reporting. By following our Editorial Policy, our writers verify every source, fact-check each story, rely on reputable sources, and attribute quotes and media correctly. We also follow a rigorous Review Methodology when evaluating exchanges and tools. From emerging blockchain projects and coin launches to industry events and technical developments, we cover all facets of the digital asset space with unwavering commitment to timely, relevant information.

Related Articles


- Trump’s Truth Social Files For Bitcoin, Ethereum, Cronos Crypto ETFs Amid Institutional Outflows
- Trump Tariffs: U.S. Supreme Court Sets February 20 for Potential Tariff Ruling
- Brazil Targets 1M BTC Strategic Reserve to Rival U.S. Bitcoin Stockpile
- Breaking: U.S. CPI Inflation Falls To 4-Year Low Of 2.4%, Bitcoin Rises
- Bitget Launches Gracy AI For Market Insights Amid Crypto Platforms Push For AI Integration
- Bitcoin Price Outlook As Gold And Silver Lose $3.6 Trillion in Market Value
- XRP and Ethereum Price Prediction as Trump Seeks to Lower Key Tariffs
- Solana Price Prediction as $2.6 Trillion Citi Expands Tokenized Products to SOL
- Bitcoin Price Could Fall to $50,000, Standard Chartered Says — Is a Crash Coming?
- Cardano Price Prediction Ahead of Midnight Mainnet Launch
- Pi Network Price Prediction as Mainnet Upgrade Deadline Nears on Feb 15


