

Demand Pressure at Key $1500 Support Hints ETH Price Rally of 15%


The October opening weeks have proven harsh for Ethereum, as the cryptocurrency saw its value drop from $1,765 to a present-day trading figure of $1,538. This 10.7% descent effectively nullified all of the obtained gains from the previous month, dragging it back to the crucial $1,500 support level. However, will this support serve as a springboard for the coin price to return to its recovery path?
Also Read: Mastercard and Australia’s RBA Triumph in Wrapped CBDC Trial
Will ETH Price Rebound from $1500
- The dual support of $1500 and support trendline hints at a 15% upswing
- Reversal from $1500 could lead to the formation of a bullish reversal pattern called double bottom
- The intraday trading volume in Ether is $4.89 Billion, indicating a 3.2% loss.
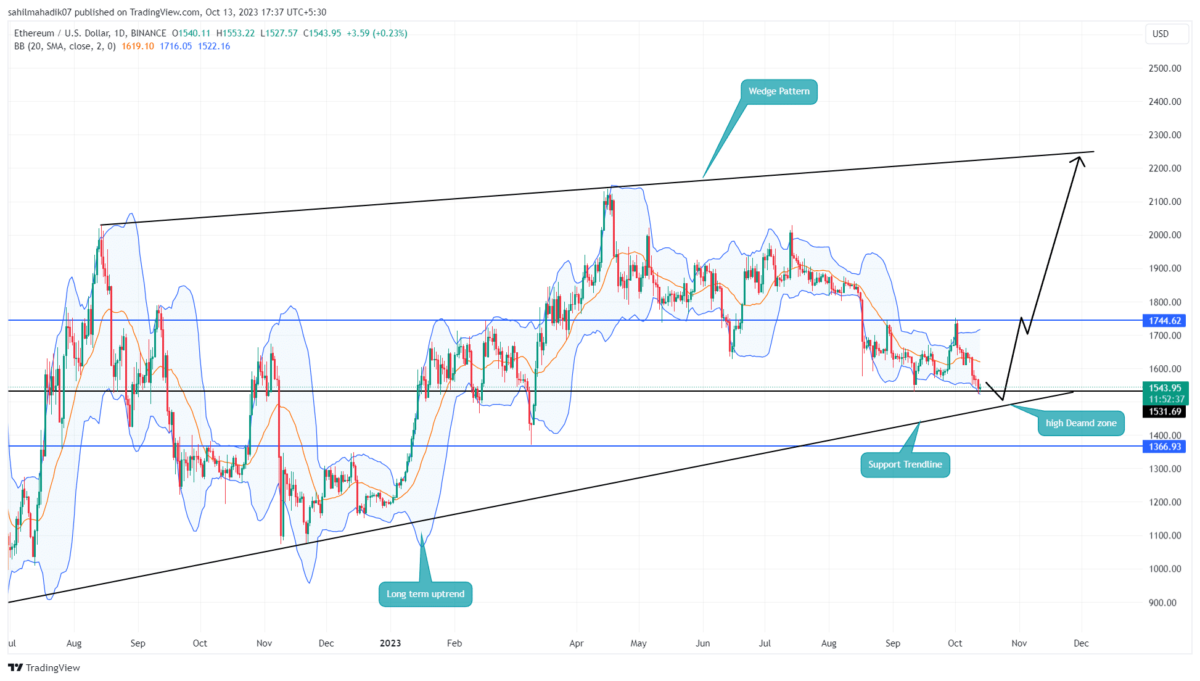
 Source- Tradingview
Currently, the Ethereum price shows an intraday gain of 0.3%, forming a Doji-type candlestick at the $1,530 support. Such a neutral pattern after a pronounced downturn often signals the exhaustion of bearish momentum.
Furthermore, the daily chart presents an ascending trendline hovering around the $1,500 level, adding an extra layer of support for bullish traders. This trendline is part of a larger rising wedge pattern that has been driving the ETH price recovery for over a year.
Should buyers manage to maintain prices above this dual-support zone, we could see a bullish leap back to the $1,745 level. Theoretically, a bullish reversal within the rising wedge could fuel a rally toward the overhead trendline, suggesting that this altcoin; ‘s next recovery cycle might break the $2,200 ceiling.
[converter id=”eth-ethereum” url=”https://coingape.com/price/converter/eth-to-usd/?amount=1″]
ETH vs BTC Performance
 Source: Coingape| Ethereum Vs Bitcoin Price
The growing supply pressure in the altcoin market has forced Ethereum coin into an aggressive V-top reversal, sending the coin tumbling to a 7-month low of $1,522. This movement indicates that sellers have the upper hand for the time being. Interestingly, the Bitcoin price has shown resilience in the same period, witnessing only a shallow correction and maintaining its position above its last swing-low support of $2,500. This contrasting behavior between Ethereum and Bitcoin points to the diverging market sentiments for the two leading cryptocurrencies.
- Bollinger band. The downtick in the lower band of the Bollinger band indicator reflects the bearish sentiment is aggressive.
- Moving Average Convergence Divergence: The bearish crossover state between the MACD(blue) and signal(orange) slope reflects the aggressive bearish tone in the market.

Why Trust CoinGape
CoinGape has covered the cryptocurrency industry since 2017, aiming to provide informative insights Read more…to our readers. Our journal analysts bring years of experience in market analysis and blockchain technology to ensure factual accuracy and balanced reporting. By following our Editorial Policy, our writers verify every source, fact-check each story, rely on reputable sources, and attribute quotes and media correctly. We also follow a rigorous Review Methodology when evaluating exchanges and tools. From emerging blockchain projects and coin launches to industry events and technical developments, we cover all facets of the digital asset space with unwavering commitment to timely, relevant information.
Premium Partners


Related Articles


- Trump Declares Tariffs Creating “Great Wealth” as Fed Rate Cut Odds Collapse to 14%
- Grok AI: Post-2020 Gold & Silver Peak Sparked Epic Gains in BTC, NASDAQ, and S&P
- Fed Pumps $2.5B Overnight—Will Crypto Market React?
- Crypto-Based Tokenized Commodities Near $4B Milestone as Gold and Silver Hit Record Highs
- Largest Ethereum Treasury Company Bitmine Enters Staking, Deposits 74,880 ETH
- Pi Network Price Holds $0.20 After 8.7M PI Unlock, 19M KYC Milestone-What’s Next?
- XRP Price Prediction Ahead of US Strategic Crypto Reserve
- Ethereum Price Prediction Ahead of the 2026 Glamsterdam Scaling Upgrade – Is $5,000 Back in Play?
- Cardano Price Eyes a 40% Surge as Key DeFi Metrics Soar After Midnight Token Launch
- FUNToken Price Surges After MEXC Lists $FUN/USDC Pair
- Bitcoin Price on Edge as $24B Options Expire on Boxing Day — Is $80K About to Crack?


