Demand Pressure at Key $1500 Support Hints ETH Price Rally of 15%
The October opening weeks have proven harsh for Ethereum, as the cryptocurrency saw its value drop from $1,765 to a present-day trading figure of $1,538. This 10.7% descent effectively nullified all of the obtained gains from the previous month, dragging it back to the crucial $1,500 support level. However, will this support serve as a springboard for the coin price to return to its recovery path?
Also Read: Mastercard and Australia’s RBA Triumph in Wrapped CBDC Trial
Will ETH Price Rebound from $1500
- The dual support of $1500 and support trendline hints at a 15% upswing
- Reversal from $1500 could lead to the formation of a bullish reversal pattern called double bottom
- The intraday trading volume in Ether is $4.89 Billion, indicating a 3.2% loss.
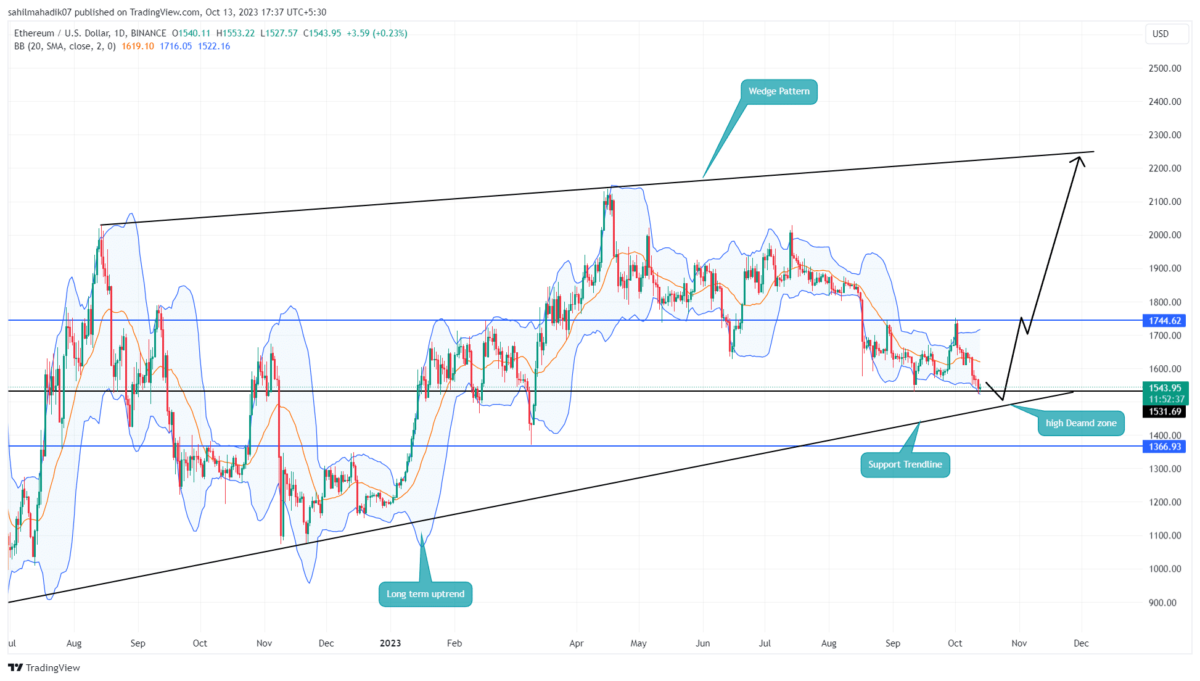
Currently, the Ethereum price shows an intraday gain of 0.3%, forming a Doji-type candlestick at the $1,530 support. Such a neutral pattern after a pronounced downturn often signals the exhaustion of bearish momentum.
Furthermore, the daily chart presents an ascending trendline hovering around the $1,500 level, adding an extra layer of support for bullish traders. This trendline is part of a larger rising wedge pattern that has been driving the ETH price recovery for over a year.
Should buyers manage to maintain prices above this dual-support zone, we could see a bullish leap back to the $1,745 level. Theoretically, a bullish reversal within the rising wedge could fuel a rally toward the overhead trendline, suggesting that this altcoin; ‘s next recovery cycle might break the $2,200 ceiling.
[converter id=”eth-ethereum” url=”https://coingape.com/price/converter/eth-to-usd/?amount=1″]
ETH vs BTC Performance
The growing supply pressure in the altcoin market has forced Ethereum coin into an aggressive V-top reversal, sending the coin tumbling to a 7-month low of $1,522. This movement indicates that sellers have the upper hand for the time being. Interestingly, the Bitcoin price has shown resilience in the same period, witnessing only a shallow correction and maintaining its position above its last swing-low support of $2,500. This contrasting behavior between Ethereum and Bitcoin points to the diverging market sentiments for the two leading cryptocurrencies.
- Bollinger band. The downtick in the lower band of the Bollinger band indicator reflects the bearish sentiment is aggressive.
- Moving Average Convergence Divergence: The bearish crossover state between the MACD(blue) and signal(orange) slope reflects the aggressive bearish tone in the market.
Recent Posts
- Price Analysis
Pi Network Price Holds $0.20 After 8.7M PI Unlock, 19M KYC Milestone-What’s Next?
Pi Network price continues to trade just above the crucial $0.20 support, despite ongoing weakness…
- Price Analysis
XRP Price Prediction Ahead of US Strategic Crypto Reserve
As the year comes to an end, XRP price hovers near the $1.80 support level,…
- Price Analysis
Ethereum Price Prediction Ahead of the 2026 Glamsterdam Scaling Upgrade – Is $5,000 Back in Play?
Ethereum price is in a critical stage as ETH price is in line with the…
- Price Analysis
Cardano Price Eyes a 40% Surge as Key DeFi Metrics Soar After Midnight Token Launch
Cardano price remains in a deep bear market, continuing a sell-off that started in December…
- Price Analysis
FUNToken Price Surges After MEXC Lists $FUN/USDC Pair
FUNToken, one of the most talked-about low-cap cryptos on the market with P2E undertones, has…
- Price Analysis
Bitcoin Price on Edge as $24B Options Expire on Boxing Day — Is $80K About to Crack?
Bitcoin enters the final stretch of the year with the price behavior signaling a decisive…