Demand Pressure at Key Support Hints ETH Price Surge to $1800


The ongoing correction in the Ethereum coin has taken a temporary halt at $1600 psychological support. Within a week, the ETH price showed two bounce back from the aforementioned support with long tail rejection candles indicating the presence of high demand pressure. Is this demand pressure sufficient to bring recovery sentiment or should coin holders prepare for further correction?
Also Read: Next Trigger For Bitcoin And Ethereum Amid Crypto Market Uncertainty
Ethereum Daily Chart: Key Points
- The Ethereum Fear and Greed Index at 28% accentuates the bearish sentiment in the market
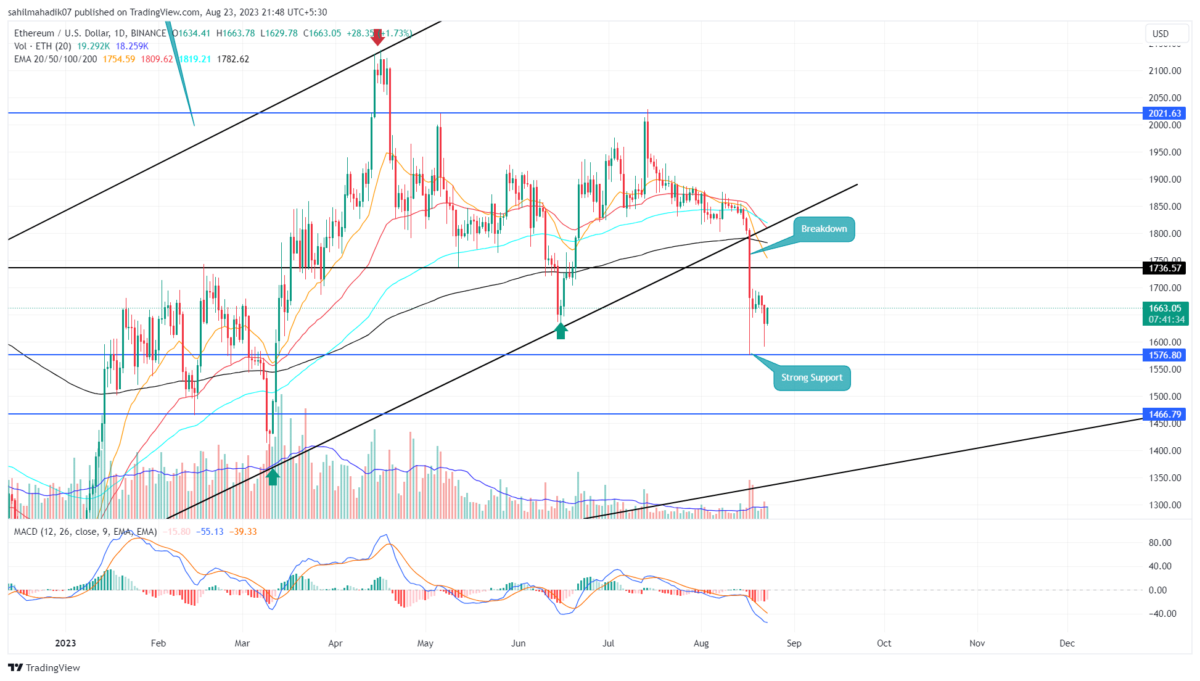
- A breakdown below the $1576 support coin tumbles the altcoin by 11%
- The intraday trading volume in Ether is $8.5 Billion, indicating a 111% gain.
 Source- Tradingview
The last six days’ price action of Ethereum coin has traded within the range of August 17th candle(High-$1808 and low-$1576). This day, the crypto market witnessed a sudden sell-off and led to a prolonged correction in the majority of major cryptocurrencies.
The aforementioned candle holds a strong influence on ETH price as it was backed by high volume and gave a massive breakdown from the support trendline of the channel pattern. The post-breakdown fall plunged the price to $1576 low before witnessing a surge in demand pressure. The daily chart reflects the buyers taking support from $1600 psychological support, leading to a minor pullback in the current trend.
If the buying pressure rises, the coin price could witness a pullback to $1800 to recuperate the exhausted bearish momentum. Until the Ethereum coin trades below the mentioned $1808 high, the seller’s weapon will remain intact which eventually bolsters the downtrend continuation.
[converter id=”eth-ethereum” url=”https://coingape.com/price/converter/eth-to-usd/?amount=1″]
Will the ETH Price Plunge to $1400?
At the time of writing the Ethereum coin traded at $1657 with an intraday gain of 1.35%. In response to the bearish market sentiment and the breakdown of the channel pattern, the altcoin price is more likely to plunge lower. For additional confirmation, the short sellers can wait for a breakdown below the aforementioned low of $1576 which may lead the prices back to the $1400 mark.
- Exponential Moving Average: The ETH price trading far lower than to 20-day EMA indicates aggressive selling in the market. Therefore, a minor pullback will be healthy before the downward projection continues.
- Moving Average Convergence Divergence: A bearish crossover state between the MACD(blue) and signal(orange) reflects the market trend is bearish.

Why Trust CoinGape
CoinGape has covered the cryptocurrency industry since 2017, aiming to provide informative insights Read more…to our readers. Our journal analysts bring years of experience in market analysis and blockchain technology to ensure factual accuracy and balanced reporting. By following our Editorial Policy, our writers verify every source, fact-check each story, rely on reputable sources, and attribute quotes and media correctly. We also follow a rigorous Review Methodology when evaluating exchanges and tools. From emerging blockchain projects and coin launches to industry events and technical developments, we cover all facets of the digital asset space with unwavering commitment to timely, relevant information.

Related Articles


- BlackRock Amends Filing For Staked Ethereum ETF, Eyes 18% of Staking Rewards From ETH Fund
- Arizona Advances Bitcoin, XRP Reserve Bill Using Seized Crypto Assets
- Bitcoin ETF Update: BlackRock Signals BTC Sell-Off as Kevin O’Leary Warns of Decline In Institutional Demand
- Breaking: Tom Lee’s BitMine Buys 45,759 ETH as CryptoQuant Flags Potential Bottom For Ethereum
- Breaking: U.S. CFTC Moves To Defend Polymarket, Kalshi From Regulatory Crackdown By State Regulators
- Pi Network Price Beats Bitcoin, Ethereum, XRP as Upgrades and Potential CEX Listing Fuels Demand
- 5 Things Dogecoin Price Needs to Hit $0.20 in Feb 2026
- Bitcoin Price Prediction as Experts Warns of Quantum Risks
- Dogecoin, Shiba Inu, Pepe Coin Price Predictions As BTC Crashes Below $68k
- Ethereum Price Outlook as Harvard Shifts Focus from Bitcoin to ETH ETF
- HOOD and COIN Stock Price Forecast as Expert Predicts Bitcoin Price Crash to $10k


