
Dogecoin Price Analysis: Bearish Pattern Raises Doubts For $0.1 Price Target


Dogecoin Price Analysis: Over the past five weeks, the Dogecoin price has shown a silent recovery within a rising wedge pattern. The coin price has rebounded thrice from the pattern’s converging trendlines, indicating the strong influence of this setup on market participants. So far the bullish recovery has registered 40% growth and reached a monthly resistance of $0.0748. Can buyers continue this recovery to $0.1?
Also Read: Elon Musk’s X.AI Shoots An Unrelated Token’s Price By 780%; Crypto AI Tokens Also Up
Dogecoin Price Daily Chart
- Overhead supply hints the Dogecoin price could tumble 7% in the coming week
- The convergence of the 200-day EMA slope with the $0.0748 price level forms a significant area of resistance
- The 24-hour trading volume in the Dogecoin coin is $450.5 Million, indicating a 56% loss.
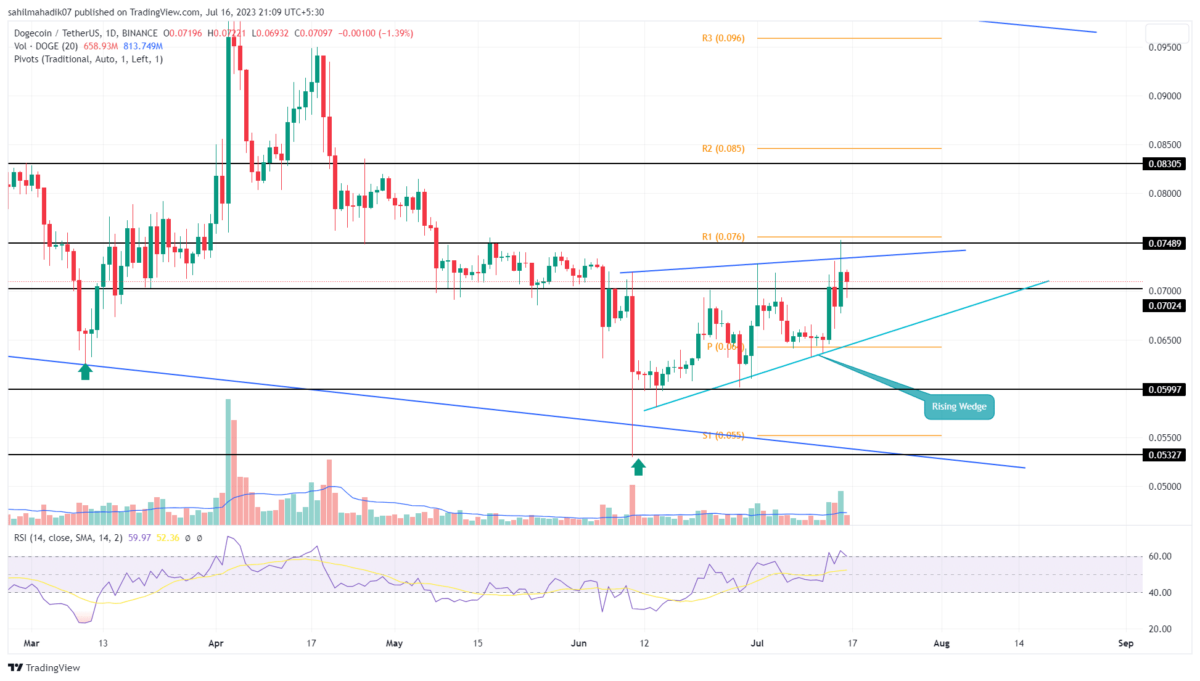
 Source-Tradingview
The Dogecoin price currently trades at the $0.0713 mark and witnesses supply pressure at the resistance trendline of the rising wedge pattern. The formation of the hammer candle(long-tail and short-body at the top) at this resistance indicates the sellers are active and may plunge the prices back to lower supports.
The potential reversal could pull the price back to the lower trendline, registering a potential loss of around 7%. However, until the converging trendlines are intact, the DOGE price won’t witness a significant direction move.
This narrowing range can be considered a no-trading zone, and a genuine breakout from either level of the wedge could bolster the respective trend.
[converter id=”doge-dogecoin” url=”https://coingape.com/price/converter/doge-to-usd/?amount=1″]
Will Dogecoin Price Revisit $0.053?
The rising wedge pattern observed in the Dogecoin price chart is typically considered a downtrend continuation pattern, providing a temporary pause for sellers to gather momentum. Therefore, the popular memecoin is more likely to break the bottom trendline and plunge the prices by some 20% to hit $0.053.
- Pivot Level: The Support/Resistance indicator shows the Doge price could witness supply pressure at $0.0755 and $0.0846 and demand pressure at $0.064 and $0.055.
- Relative Strength Index: The daily RSI slope above 60% reflects a strong bullish momentum.

Why Trust CoinGape
CoinGape has covered the cryptocurrency industry since 2017, aiming to provide informative insights Read more…to our readers. Our journal analysts bring years of experience in market analysis and blockchain technology to ensure factual accuracy and balanced reporting. By following our Editorial Policy, our writers verify every source, fact-check each story, rely on reputable sources, and attribute quotes and media correctly. We also follow a rigorous Review Methodology when evaluating exchanges and tools. From emerging blockchain projects and coin launches to industry events and technical developments, we cover all facets of the digital asset space with unwavering commitment to timely, relevant information.


