Dogecoin Price Analysis: DOGE Drops 4% Today; Find’s Next Crucial Target


Dogecoin price analysis revealed a negative bias for the day. The price opened higher but failed to hold onto the gains and slipped to test the intraday low of $0.065. However, the coin has recovered but still trading in red for the past few hours.
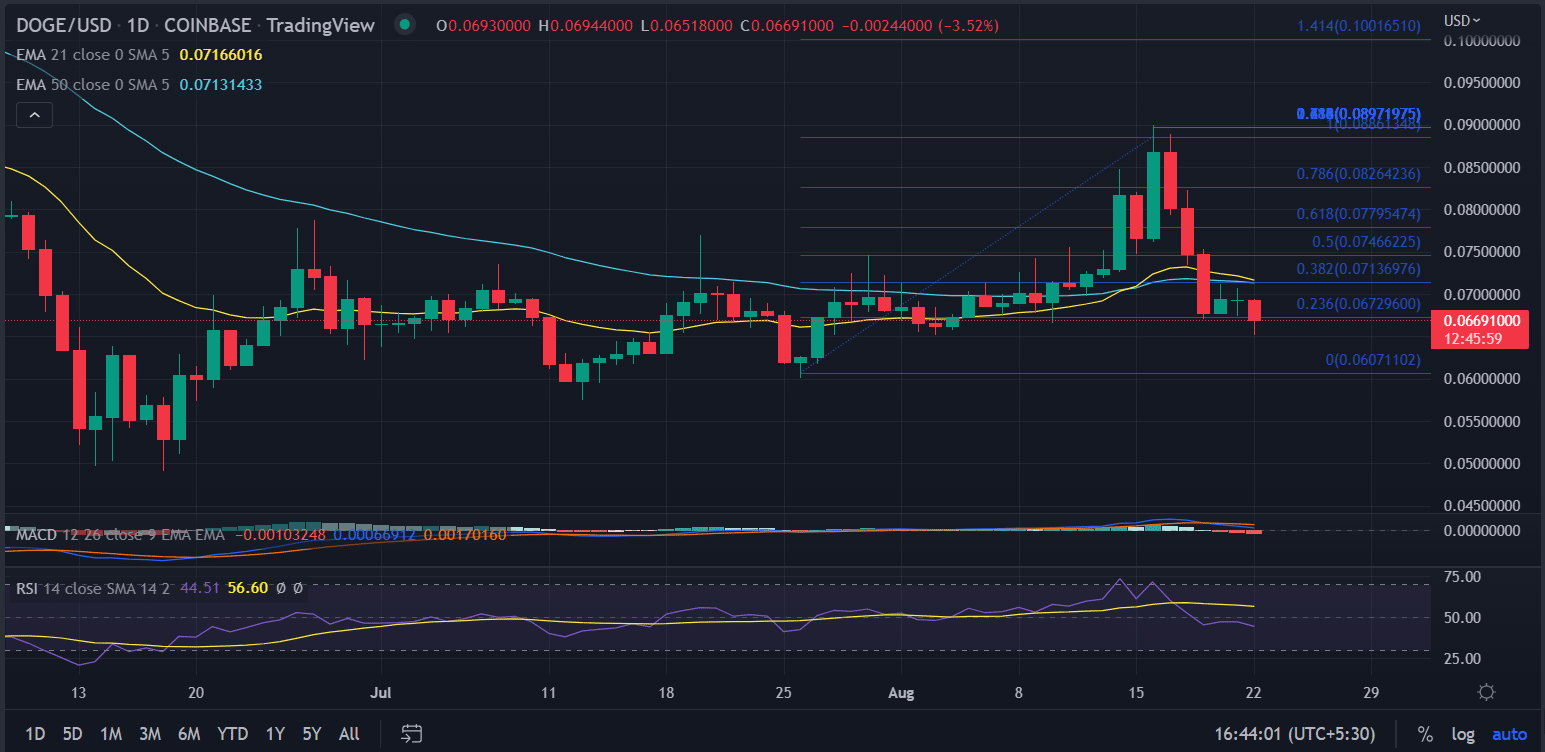
The sellers turned aggressive below the critical 21-day and 50-day moving average crossover as the price breached it on August 19. Since then, there is a depreciation of nearly 10%.
DOGE is matching with the frequency of the broader crypto fall as the current market structure is favoring the bears. Due to some support emerging at the near lower level, the price attempted to scale back to $0.068.
But is the corrective pullback sustainable?
- Dogecoin failed to maintain the corrective pullback and slide lower on Monday.
- A decisive break above $0.70 could bring a short-term relief rally.
- However, momentum oscillators favor the bearish sentiment.
Dogecoin looks vulnerable
On the daily chart, the Dogecoin price analysis suggests the downside risk remains intact.
DOGE buyers are looking miserable after falling from the swing high of $0.09 made on August 16. The price immediately retraced and corrected 27% in six days.
Currently, the price is taking support near the reliable short-term resistance zone of $0.066 that extends from May. So, we expect a renewed buying pressure could pump up the price back into the higher trajectories. But, looking at the chart, we found the price briefly breached the critical support area on June 12, and tested the all-time low of $0.049 on June 18. There was no looking back since then, except for a reversal in the uptrend witnessed on August 19.
The RSI (14) trades below the average line with a negative bias. Currently, it reads at 42, still far from the oversold zone.
The MACD holds above the mid-line but with a bearish crossover. The increasing downside histogram indicated the sellers are still active.
We expect, the price to drop toward the low of July 26 at $0.060 as the momentum oscillators still favor the bearish outlook.
Further, if the selling persists DOGE could meet another horizontal support near $0.057.
On the other hand, a daily candlestick above the session’s high would mean buyer’s participation near the lower levels to capitalize on the bargain buying opportunity.
In conclusion, the price is taking support at the 0.23% Fibo. retracement level. In addition, the pressure is built up by the break of the 21-day and 50-day EMA crossover. More downside is if the price trades below $0.065 on an hourly basis.
As of press time, DOGE/USD is trading at $0.066, down 3.19% for the day.

Why Trust CoinGape
CoinGape has covered the cryptocurrency industry since 2017, aiming to provide informative insights Read more…to our readers. Our journal analysts bring years of experience in market analysis and blockchain technology to ensure factual accuracy and balanced reporting. By following our Editorial Policy, our writers verify every source, fact-check each story, rely on reputable sources, and attribute quotes and media correctly. We also follow a rigorous Review Methodology when evaluating exchanges and tools. From emerging blockchain projects and coin launches to industry events and technical developments, we cover all facets of the digital asset space with unwavering commitment to timely, relevant information.
Related Articles


- Breaking: Bitcoin Bounces as U.S. House Passes Bill To End Government Shutdown
- Why Is The BTC Price Down Today?
- XRP’s DeFi Utility Expands as Flare Introduces Modular Lending for XRP
- Why Michael Saylor Still Says Buy Bitcoin and Hold?
- Crypto ETF News: BNB Gets Institutional Boost as Binance Coin Replaces Cardano In Grayscale’s GDLC Fund
- Ondo Price Prediction as MetaMask Integrates 200+ Tokenized U.S. Stocks
- XRP Price Risks Slide to $1 Amid Slumping XRPL Metrics and Burn Rate
- Gold and Silver Prices Turn Parabolic in One Day: Will Bitcoin Mirror the Move?
- Cardano Price Prediction as the Planned CME’s ADA Futures Launch Nears
- HYPE Price Outlook After Hyperliquid’s HIP-4 Rollout Sparks Prediction-Style Trading Boom
- Top 3 Meme coin Price Prediction: Dogecoin, Shiba Inu And MemeCore Ahead of Market Recovery


