Dogecoin Price Analysis Hints High Volatility Before an Explosive Move


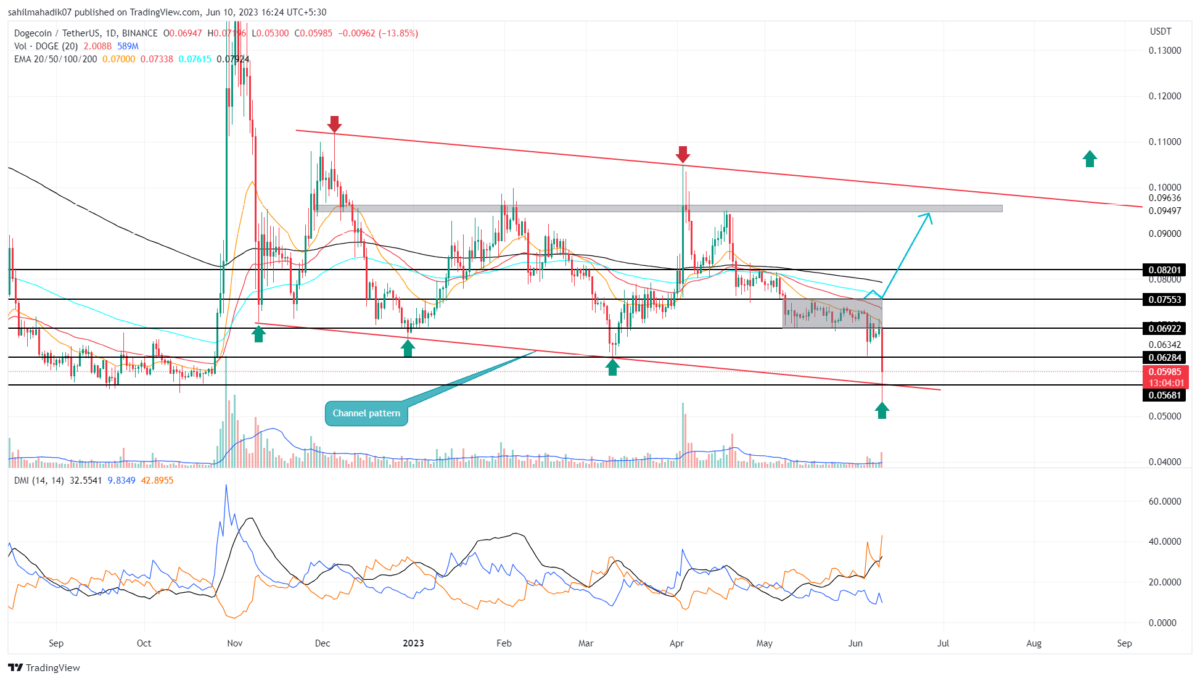
Dogecoin Price Analysis: For over a week, the Dogecoin price has remained flattish trading below a local resistance of $0.063. The daily chart showed several short-bodied candles, indicating a lack of initiation from buyers or sellers to retake trend control. Despite this uncertainty, the DOGE price has not violated the levels of the falling channel pattern, validating it as a crucial setup to predict future prices.
Also Read: Elon Musk Refutes Owning Pump-Dump “Dogecoin Wallets”
Dogecoin Price Daily Chart
- The support trendline of the channel pattern may prevent the DOGE price from excessive downfall.
- A breakout above the $0.063 resistance would signal an upcoming relief rally
- The 24-hour trading volume in the Dogecoin coin is $182.5 Million, indicating a 0.74% gain.
 Source-Tradingview
Dogecoin traders are still trying to stabilize the price action after the massive on June 10th. Though the coin price found suitable support at the lower trendline of the channel pattern, the buyers are struggling to regain higher grounds
By the press time, the Dogecoin price traded at $0.0618 with an intraday loss of 0.43%. The daily chart shows higher price rejection at the immediate resistance of $0.063, suggesting the sellers continue to pressurize the coin price.
Therefore, it is likely the Dogecoin price prolongs the current consolidation until the buyers recuperate the bullish momentum. Under the pessimistic scenario, the price could retest the $0.056 support to attract more buyers at discounted value.
Will Dogecoin Price Reach $0.07?
A retest to the channel pattern’s support trendline usually triggers a significant upswing back to the upper trendline. However, a bullish breakout from $0.063 overhead resistance with daily candle closing will be the first signal for Doge traders for potential recovery. This breakout will provide buyers with a stepping stone to climb higher and a lead price of 12% higher to reach the $0.07 psychological barrier.
- Exponential Moving Average: The dynamic resistance of 20-day EMA could increase the resistance power of $0.063 resistance.
- Directional Movement Index: The DI+ and DI- slopes gradually nearing a bullish crossover indicating the losing bearish momentum.

Why Trust CoinGape
CoinGape has covered the cryptocurrency industry since 2017, aiming to provide informative insights Read more…to our readers. Our journal analysts bring years of experience in market analysis and blockchain technology to ensure factual accuracy and balanced reporting. By following our Editorial Policy, our writers verify every source, fact-check each story, rely on reputable sources, and attribute quotes and media correctly. We also follow a rigorous Review Methodology when evaluating exchanges and tools. From emerging blockchain projects and coin launches to industry events and technical developments, we cover all facets of the digital asset space with unwavering commitment to timely, relevant information.
Related Articles


- Breaking: CLARITY Act Advances as Senate Ag. Committee Votes In Favor Of Crypto Bill
- NOWPayments Review 2026 : Features, Fees & Is It Worth It?
- Atkins Backs Crypto in 401(k)s as SEC and CFTC Hold Regulation Harmonization Roundtable
- Trump Calls For Immediate Fed Rate Cuts After FOMC Holds Rates Steady
- Breaking: U.S. Jobless Claims Come In Above Expectations; Bitcoin Unchanged
- Ethereum and XRP Price Prediction as Odds of Trump Attack on Iran Rise
- Gold and S&P 500 Price Prediction as BTC $88K Sparks Global Risk-On Rally
- How High Can Hyperliquid Price Go in Feb 2026?
- Top Meme Coins Price Prediction: Dogecoin, Shiba Inu, Pepe, and Pump. Fun as Crypto Market Recovers.
- Solana Price Targets $200 as $152B WisdomTree Joins the Ecosystem
- XRP Price Prediction After Ripple Treasury launch


