Dogecoin Price Analysis: Is $DOGE Price Ready to Reclaim $0.08 Mark?
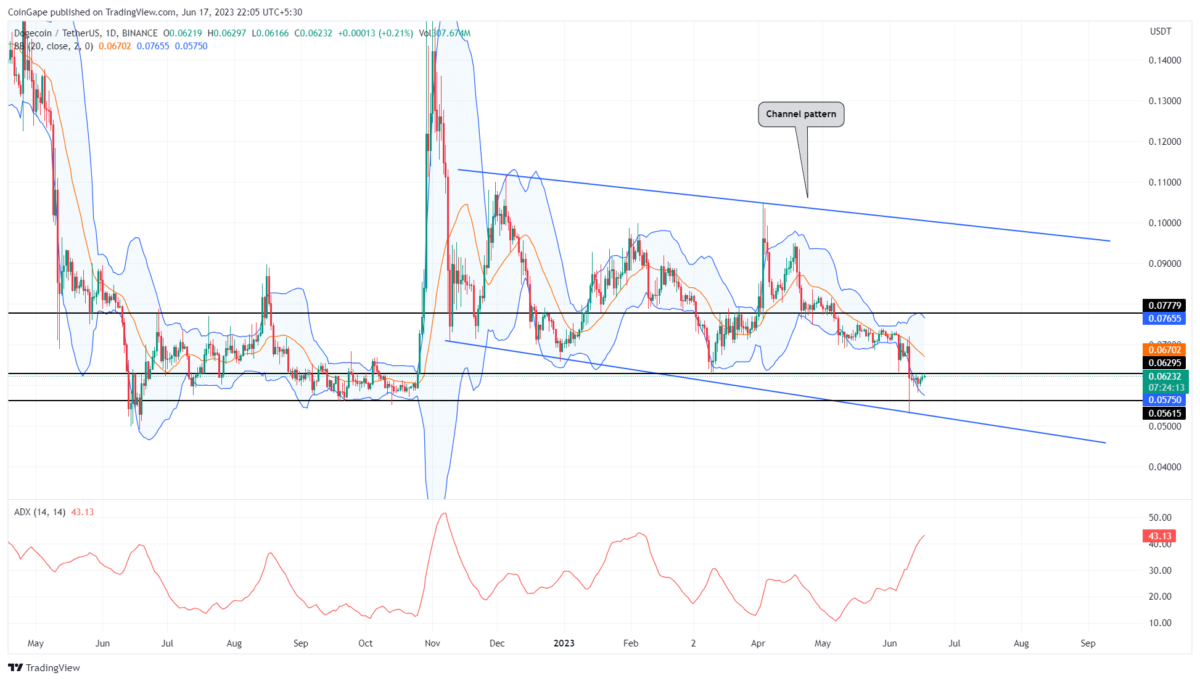
Dogecoin Price Analysis: Amidst the market sell-off on June 10th, the Dogecoin price printed a long-tail rejection candle in the daily chart. This rejection candle formed at the base support of the falling channel pattern indicating the presence of high demand pressure at lower levels. If the bullish momentum rises, this level could act as the start of a new recovery cycle and offer traders an opportunity to purchase this Dog-themed memecoin.
Also Read: London Basketball Club Lends Support to DOGE and XRP
Dogecoin Price Daily Chart
- The Dogecoin price witnessed a demand pressure near the $0.056 mark
- A breakout above the $0.063 resistance could trigger a relief rally in the DOGE price.
- The 24-hour trading volume in the Dogecoin coin is $187.9 Million, indicating a 0.97% gain.
For over a week, the Dogecoin price has remained flattish, trading in a narrow range below $0.632. This sideways action could be the disorder created due to the overall downtrend, the surge in buying pressure developed by discounted prices.
By the press time, the DOGE price trades at $0.062 with an intraday loss of 0.03%. The neutral candle reflects the uncertainty continuing among traders, indicating this sideways action could extend longer.
However, a retest to the lower trendline of the channel pattern usually triggers a significant upswing back to the upper trendline. This potential reversal will offer long entry opportunity to traders with a potential target of $0.95
Will Dogecoin Price Poke $0.95?
Amid the current consolidation phase, the Dogecoin price respects two technical levels which are $0.063 and the lower trendline of the channel pattern. Under the influence of the chart pattern, the coin price is likely to revert higher to reclaim lost ground. However, interested traders must wait for the breakout of $0.063 immediate resistance to obtain an entry opportunity. The potential recovery could face selling pressure at $0.075, followed by $0.083 and $0.095.
- Bollinger Band: The bands of Bollinger band indicators challenged on the downside reflect selling pressure in the market is still active.
- Average Directional Index: The high value of ADX indicates instability in the current downturn and a higher possibility for a prolonged consolation to recovery.
Recent Posts
- Price Analysis
Will Solana Price Hit $150 as Mangocueticals Partners With Cube Group on $100M SOL Treasury?
Solana price remains a focal point as it responds to both institutional alignment and shifting…
- Price Analysis
SUI Price Forecast After Bitwise Filed for SUI ETF With U.S. SEC – Is $3 Next?
SUI price remains positioned at a critical intersection of regulatory positioning and technical structure. Recent…
- Price Analysis
Bitcoin Price Alarming Pattern Points to a Dip to $80k as $2.7b Options Expires Today
Bitcoin price rebounded by 3% today, Dec. 19, reaching a high of $87,960. This rise…
- Price Analysis
Dogecoin Price Prediction Points to $0.20 Rebound as Coinbase Launches Regulated DOGE Futures
Dogecoin price has gone back to the spotlight as it responds to the growing derivatives…
- Price Analysis
Pi Coin Price Prediction as Expert Warns Bitcoin May Hit $70k After BoJ Rate Hike
Pi Coin price rose by 1.05% today, Dec. 18, mirroring the performance of Bitcoin and…
- Price Analysis
Cardano Price Outlook: Will the NIGHT Token Demand Surge Trigger a Rebound?
Cardano price has entered a decisive phase as NIGHT token liquidity rotation intersects with structural…