Dogecoin Price Analysis: Will $DOGE Price Fall Back to $0.6?
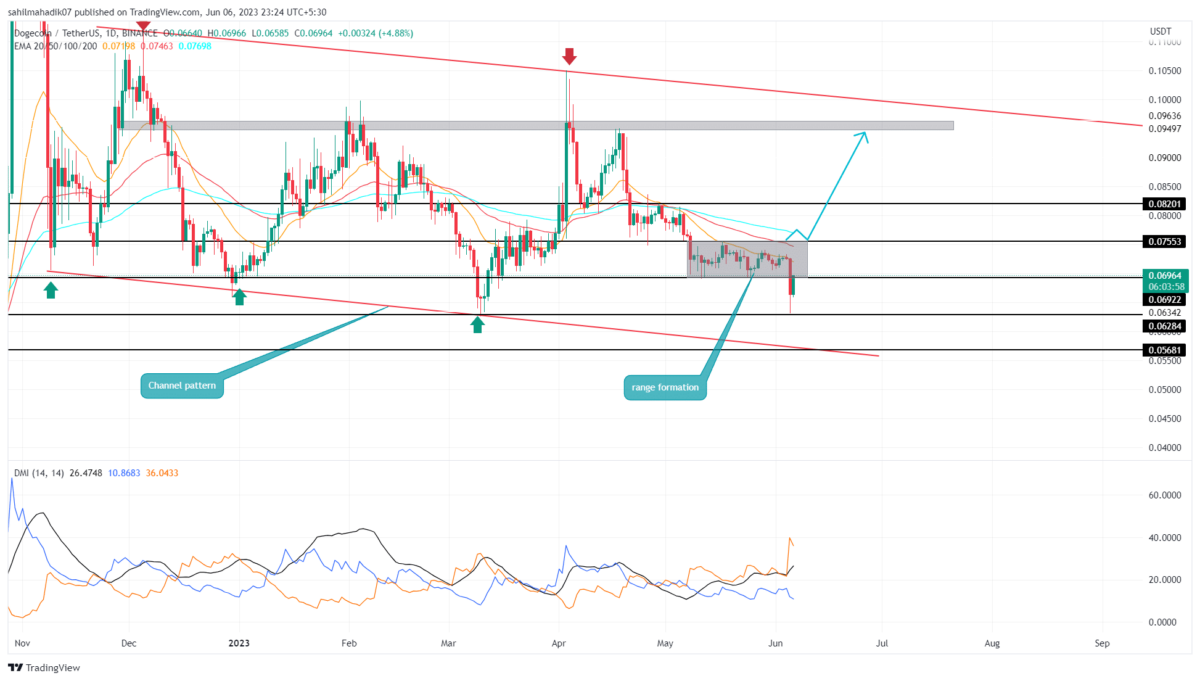
Dogecoin Price Analysis: For nearly a month, the Dogecoin price witnessed a sideways trend between the $0.075 and $0.069 levels responding to broader market uncertainty. However, with the recent sell-off in the crypto market, the range formation resulted in the sellers’ favor as the price plunged below $0.069. This breakdown hints the DOGE price is likely to resume the prevailing downtrend.
Also Read: Elon Musk Shills Dogecoin as SEC Designates Top Cryptos as Securities
Dogecoin Price Daily Chart
- A bearish breakdown from the $0.069 support could tumble the DOGE price by 17%
- The 20-day EMA slope imposes dynamic resistance on coin buyers
- The 24-hour trading volume in the Dogecoin coin is $402.5 Million, indicating a 6.6% gain.
On June 5th, the Dogecoin price registered an intraday loss of 8.5% and gave a massive breakdown from the $0.069 support. Losing this crucial support reflects the sellers’ continuing to hold a dominant hand and will further influence this memecoin.
By the press time, the DOGE price trades at $0.068 with an intraday gain of 3.2%. This bullish candle retests the breached support as potential resistance and checks whether the price can sustain lower levels or not.
In case it does, the sellers may drive the coin 17% down to reach the combined support of $0.568 and the support trendline of the channel pattern.
The bearish thesis will get invalidated if the price jumped back above $0.069
Will Dogecoin Price Tumble to $0.056
A breakdown below the monthly range support of $0.069 accelerates the selling pressure on the DOGE price. This breakdown could trigger a significant downfall to lead the prices to $0.628, followed by $0.56. However, the $0.56 support aligned with channel pattern support creates a strong accumulation zone.
- Directional Movement Index: A large gap between the bearishly aligned DI-(orange) and DI+(blue) slope indicates a bear trend.
- Exponential Moving Average: The downsloping daily EMAs(20, 50, 100, and 200) create multiple hurdles on the upside.
Recent Posts
- Price Analysis
Cardano Price Outlook: Will the NIGHT Token Demand Surge Trigger a Rebound?
Cardano price has entered a decisive phase as NIGHT token liquidity rotation intersects with structural…
- Price Analysis
Will Bitcoin Crash to $74K as Japan Eyes Rate Hike on December 19?
Bitcoin price continues to weaken after breaking below its recent consolidation range, now trading within…
- Price Analysis
Bitwise Predicts Solana Price Will Hit New All-Time Highs in 2026
Solana price declined by 4% over the past 24 hours, breaking below the key $130…
- Price Analysis
Bitcoin Price Outlook: Capriole Founder Warns of a Drop Below $50K by 2028
Bitcoin price narratives continue to evolve as long-term downside risks regain attention. Bitcoin price discussions…
- Price Analysis
XRP Price Rare Pattern Points to a Surge to $3 as ETFs Cross $1B Milestone
XRP price dropped by 1.2% today, Dec. 17, continuing a downward trend that started in…
- Price Analysis
DOGE Whales Add 138M Coins in 24 Hours: Will Dogecoin Price Rebound Above $0.15?
Dogecoin price traded at $0.1304 on Tuesday, up 1.39% in the last 24 hours.…