Dogecoin Price Analysis: Will $DOGE Price Hit $0.082 or $0.065?
Dogecoin Price Analysis: Amidst a volatile market environment, the Dogecoin price has displayed a sideways movement between the $0.075 and $0.069 mark. Using the aforementioned $0.069 as base support this memecoin shows the formation of a double bottom pattern. This bullish setup is often spotted at the market bottom and offers a significant upswing on the breakout of its neckline resistance. Here’s how interested traders may grab a long opportunity using this pattern.
Also Read: Memecoins Prints Selective Growth as Crypto Market Recovers, Here are the High Fliers
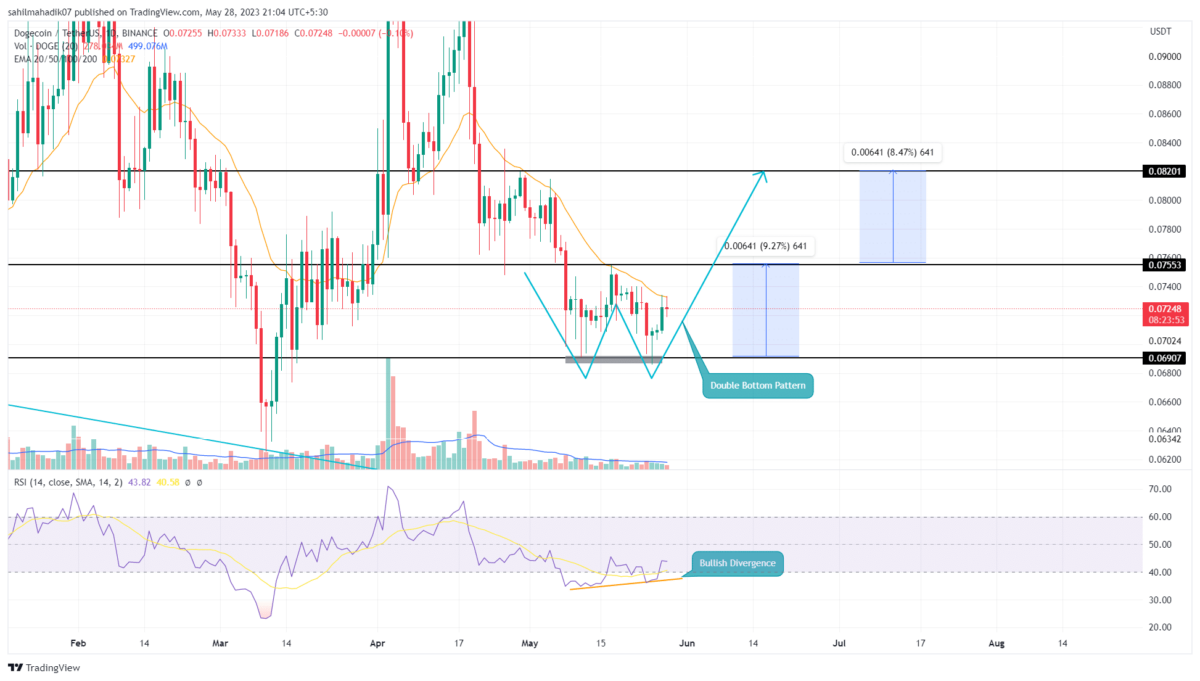
Dogecoin Price Daily Chart
- Dogecoin price has set up a double-bottom pattern that forecasts an 8.5% rise on a successful breakout from $0.075.
- Any reversal signs at $0.075 will indicate the continuation of a sideways trend.
- The 24-hour trading volume in the Dogecoin coin is $328.5 Million, indicating a 36% gain.
On May 25th, the Dogecoin price rebounded from the local support zone of $0.069. The bullish reversal surged the prices 4.88% higher to hit the current price of $0.072.
However, under the development of the double bottom pattern, this bullish upswing is likely to rise higher and hit the immediate resistance of $0.0755. This barrier is the neckline resistance of the chart pattern and the peaked ceiling of an ongoing consolidation phase.
Thus, a successful break above the $0.072 will increase the buying pressure and surge the DOGE price by 8.5% to hit the $0.082 ceiling.
Will Dogecoin Price Reach $0.082?
Under the influence of a double-bottom pattern, the Dogecoin price is poised to break the overhead resistance of $0.075. A potential breakout above this barrier will offer buyers a firm footing to extend this recovery and hit $0.082.
- Relative Strength Index: A Bullish divergence in the daily RSI slope reflects the buying pressure rising at lower levels and additional confirmation of a bullish rally.
- Exponential Moving Average: The dynamic resistance of the 20-day EMA currently obstructs the rising price and may undermine the bullish thesis.
Recent Posts
- Price Analysis
Bitcoin Price Prediction as US Govt. Shutdown Extends- What’s Next for BTC?
Bitcoin price continues to trade within a defined consolidation range as the broader crypto market…
- Price Analysis
Solana Price Megaphone Points to a Parabolic Move as SOL Treasuries Near $3B
Solana price pulled back today, Oct. 8, mirroring the performance of the broader crypto market,…
- Price Analysis
XRP Price Prediction Amid ETF Approval Roadblock as Analyst Warns of $2.72 Dip
The XRP price continues to draw attention as market analyst, Ali Charts, warns of a…
- Price Analysis
Binance Coin Price Prediction If It Surpasses Bitcoin Marketcap— Is $3000 Possible in 2025?
The BNB Coin price continues to extend its upward trajectory, reflecting consistent market strength and…
- Price Analysis
ASTER vs HYPE Price Analysis – Which Perp DEX Token Looks Poised to Dominate Q4 Performance?
The ASTER price has slipped by 2.37% over the past 24 hours, while the HYPE…
- Price Analysis
Ethereum Price Could Soar to $6,500 as BlackRock’s ETF Nears $20B Milestone
Ethereum price could be on the verge of a strong bullish breakout in the coming…