Dogecoin Price Analysis: Will $DOGE Price Recovery Push Past $0.07 Barrier?
Dogecoin Price Analysis: On July 1st, the Dogecoin price gave a bullish breakout from a downsloping trendline as a signal for potential recovery. However, as the positive sentiment built around spot Bitcoin ETF fades, the crypto market witnessed a downturn in mid-weeks, and several major cryptocurrencies halted their recovery rally. Thus, the popular Memecoin DOGE plunged back to the breached trendline proving its sustainability for the higher prices.
Also Read: Dogecoin Price Recovers After Largest DOGE Shorting of 2023
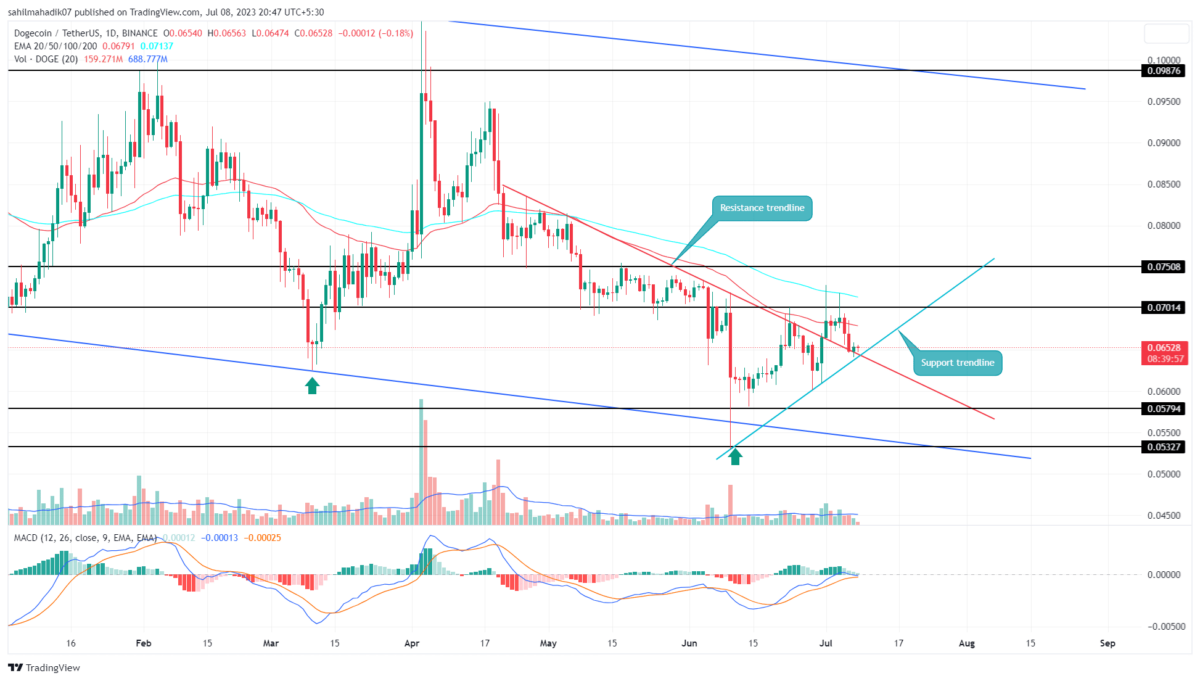
Dogecoin Price Daily Chart
- A breakdown below the support trendline could set the $DOGE price for an 8.5% drop.
- The 100-day EMAs dynamic tries to maintain a higher bearish trend
- The 24-hour trading volume in the Dogecoin coin is $152.3 Million, indicating a 30% loss.
During early July, the Dogecoin buyers showed the first sign of weakness as prices failed to sustain above the last swing high barrier of $0.7. With negative sentiment in the market, the resulting pullback has plunged the coin price to $0.065, where it currently hovers above the confluence of the rising support trendline and recently breached the resistance trendline.
This confluence should offer suitable support for buyers to recuperate bullish momentum. Interested traders can wait for a few days and check price stability at this level before initiating a fresh long position.
A strong bullish candle at this retest could trigger an entry opportunity and an increased possibility to rechallenge $0.07. With sustained buying, the coin price can expect a resistance zone at $0.075, and $0.085.
Will Dogecoin Price Retake $0.75 High?
If the bearish momentum in the market persists, a breakdown below the support confluence of the two aforementioned trendlines could project a significant sell signal. A daily candle closing below these trendlines will offer sellers an additional barrier to pressurize prices. The potential downfall could plunge the popular memecoin 8.5% down to reach $0.058, followed by $0.053.
- Exponential Moving Average: The daily EMAs(20, 50, 100, and 200) moving above the DOGE price indicating the traders would face the least resistance on the downside.
- Moving Average Convergence Divergence: A reverse bearish divergence in the indicator’s daily chart, where the MACD(blue) and signal(orange) make higher highs and price action make lower lows indicating the buyer’s attempts are getting nullified.
Recent Posts
- Price Analysis
Cardano Price Outlook: Will the NIGHT Token Demand Surge Trigger a Rebound?
Cardano price has entered a decisive phase as NIGHT token liquidity rotation intersects with structural…
- Price Analysis
Will Bitcoin Price Crash to $74K as Japan Eyes Rate Hike on December 19?
Bitcoin price continues to weaken after breaking below its recent consolidation range, now trading within…
- Price Analysis
Bitwise Predicts Solana Price Will Hit New All-Time Highs in 2026
Solana price declined by 4% over the past 24 hours, breaking below the key $130…
- Price Analysis
Bitcoin Price Outlook: Capriole Founder Warns of a Drop Below $50K by 2028
Bitcoin price narratives continue to evolve as long-term downside risks regain attention. Bitcoin price discussions…
- Price Analysis
XRP Price Rare Pattern Points to a Surge to $3 as ETFs Cross $1B Milestone
XRP price dropped by 1.2% today, Dec. 17, continuing a downward trend that started in…
- Price Analysis
DOGE Whales Add 138M Coins in 24 Hours: Will Dogecoin Price Rebound Above $0.15?
Dogecoin price traded at $0.1304 on Tuesday, up 1.39% in the last 24 hours.…