Dogecoin Price Analysis: Will $DOGE Price Surpass $0.08 Before July End


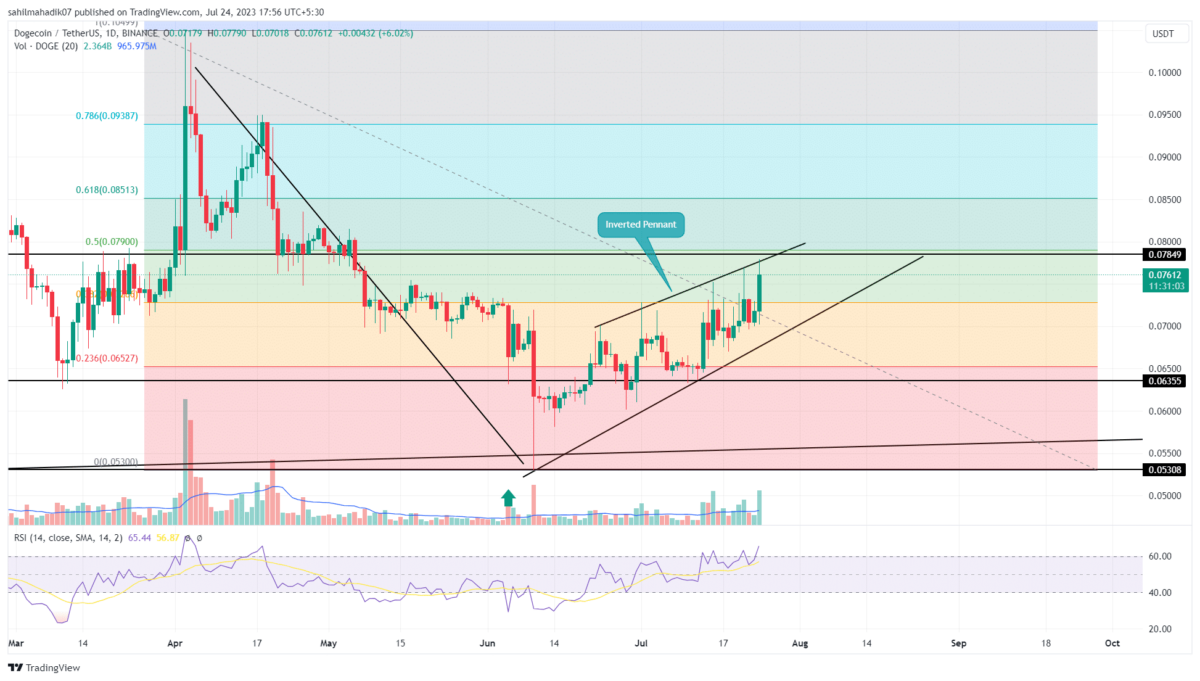
Dogecoin Price Analysis: The Dogecoin price has been riding a recovery rally over the past six weeks, and recorded 40% growth as it surged from a low of $0.53 to the current price of $0.0745. The rising price does follow the Dow theory of uptrend with new highs and lows, but the rejection candles at swing highs reflect the overhead supply pressure is intact. Amid this rally, the daily chart showed the formation of a bearish continuation pattern called an inverted pennant pattern and the possibility of extended downfall.
Also Read: This Technical Breakout on Dogecoin (DOGE) Could Lead to 23,200% Price Rally
Dogecoin Price Daily Chart
- The inverted pendant pattern indicates the Dogecoin price could witness a sharp correction in the near future.
- The $0.785 horizontal level aligned with the 50% FIB level creates and strong resistance barrier
- The 24-hour trading volume in the Dogecoin coin is $739.5 Million, indicating a 24% gain
 Source-Tradingview
The rising Dogecoin price is facing constant resistance from the resistance trendline of a pennant pattern. For over a month, the coin price has shown several reversals from this dynamic resistance indicating buyers are failing to maintain its bullish momentum.
Earlier today, the DOGE price showed nearly 8% and tried to poke through the overhead trendline. However, the intraday gain is now halved and the rejection attached to the daily candle indicates a possibility for another reversal.
The potential pullback could tumble the popular memecoin 4-5% and hit the lower trendline.
A possible breakdown from the pattern’s support trendline will release the selling pressure and may prolong the downward trend to $0.0635, followed by $0.058, and $0.053
[converter id=”doge-dogecoin” url=”https://coingape.com/price/converter/doge-to-usd/?amount=1″]
Will DOGE Price Recovery Rally Surpass $0.785?
Considering the prevailing downtrend in Dogecoin price is intact, the current recovery rally has so far reclaimed the 32.6% Fibonacci retracement level. With sustained buying, the coin price may reach the 50% FIB mark at $0.785. This combined resistance could act as a strong barrier against buyers and assist sellers to resume prior downtrend.
- Fibonacci Retracement Level: A pullback to 50% FIB level is still considered healthy for the current trend cycle. However, if the DOGE price surpasses this barrier it would indicate weakness in bearish momentum.
- Relative strength index: The daily RSI slope above 60% sufficient buying momentum to prolong the current recovery rally.
Why Trust CoinGape
CoinGape has covered the cryptocurrency industry since 2017, aiming to provide informative insights Read more…to our readers. Our journal analysts bring years of experience in market analysis and blockchain technology to ensure factual accuracy and balanced reporting. By following our Editorial Policy, our writers verify every source, fact-check each story, rely on reputable sources, and attribute quotes and media correctly. We also follow a rigorous Review Methodology when evaluating exchanges and tools. From emerging blockchain projects and coin launches to industry events and technical developments, we cover all facets of the digital asset space with unwavering commitment to timely, relevant information.
Related Articles


- BTC Price Crashes Below $85K Amid U.S.-Iran Tensions and Hawkish Fed Pivot
- Breaking: CLARITY Act Advances as Senate Ag. Committee Votes In Favor Of Crypto Bill
- NOWPayments Review 2026 : Features, Fees & Is It Worth It?
- Atkins Backs Crypto in 401(k)s as SEC and CFTC Hold Regulation Harmonization Roundtable
- Trump Calls For Immediate Fed Rate Cuts After FOMC Holds Rates Steady
- Ethereum and XRP Price Prediction as Odds of Trump Attack on Iran Rise
- Gold and S&P 500 Price Prediction as BTC $88K Sparks Global Risk-On Rally
- How High Can Hyperliquid Price Go in Feb 2026?
- Top Meme Coins Price Prediction: Dogecoin, Shiba Inu, Pepe, and Pump. Fun as Crypto Market Recovers.
- Solana Price Targets $200 as $152B WisdomTree Joins the Ecosystem
- XRP Price Prediction After Ripple Treasury launch


