Dogecoin Price Prediction: Key Resistance Breakout Hints 22% Rally Ahead


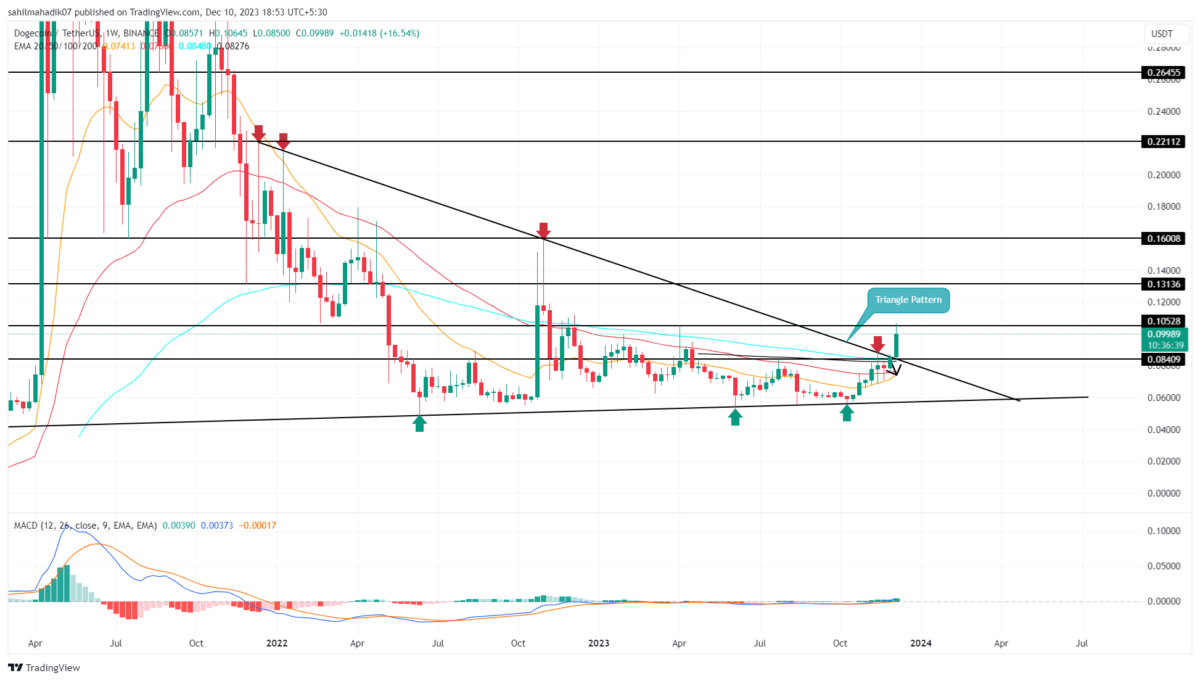
Dogecoin Price Prediction: After overcoming the long-term correction phase for the entirety of 2023, Dogecoin price took a trend-reversal action with the October rally. Giving an overhead resistance trendline breakout in the weekly chart with the Uptober rally, the meme coin started a bullish frenzy. Starting the uptrend at $0.059 the buyers help DOGE leap off to the $0.10 psychological mark.
With the momentum growing stronger, the DOGE price accounts for a 67% jump in the last eight weeks and approaches the next resistance at the $0.11 psychological zone. Will the dog-themed coin shoot past the resistance, or is a reversal looming at the corner?
Also Read: Dogecoin (DOGE) Price Soars 10%, Vitalik Buterin Wants Twitter HQ In Switzerland
Is DOGE Heading to $0.12?
- The DOGE price trend shows seven bullish candles in the last eight weeks, resulting in the ongoing breakout rally.
- The reversal rally surpasses the 200-week EMA and supports the bullish crossover with the 50-week EMA.
- The intraday trading volume in Dogecoin is $846 Million, indicating a 31% loss.

In the last two months, the Dogecoin price has found an exponential increase in the trend momentum, resulting in a sharp reversal. Mostly making bullish candles, the meme coin finally reaches the $0.10 mark within eight weeks.
Starting the week at $0.085, the DOGE pricr experienced a sharp boost as the overall market bounced back. The meme coin approaches the overhead resistance zone, leading to a 15% jump and reaching a 52-week high of $0.10645.
In short, the momentum grows for meme coins with the trendline breakout and the overall market recovery. Currently, the Dogecoin trades at $0.0997 with an intraday gain of 1.12%.
Dogecoin Ready For A Take-Off!
The Dogecoin (DOGE) recovery recently surpassing the $0.10 psychological level will bring notable changes in its market price. With a breakout rally, the meme coin will result in a brawl at the overhead resistance zone at $0.12. Further, the weekly chart signals a monumental breakout trend for Dogecoin if it exceeds $0.12 in 2024.
- EMAs: An upswing in the market price drives the 50-week EMA on a positive track and teases a golden crossover with the 200-week EMA.
- MACD: The MACD and signal lines continue the upside rally and gain momentum as the bullish histograms rise.

Why Trust CoinGape
CoinGape has covered the cryptocurrency industry since 2017, aiming to provide informative insights Read more…to our readers. Our journal analysts bring years of experience in market analysis and blockchain technology to ensure factual accuracy and balanced reporting. By following our Editorial Policy, our writers verify every source, fact-check each story, rely on reputable sources, and attribute quotes and media correctly. We also follow a rigorous Review Methodology when evaluating exchanges and tools. From emerging blockchain projects and coin launches to industry events and technical developments, we cover all facets of the digital asset space with unwavering commitment to timely, relevant information.
Related Articles


- Is the Sell-Off Just Starting? BlackRock Bitcoin ETF Sees Records $10B in Notional Volume
- How Low Can Bitcoin Dip- Peter Brandt Predicts Possible BTC Bottom
- Strategy’s Michael Saylor, CEO Phong Le Assure More Bitcoin Buy, No Liquidations Until $8K
- Crypto Market Braces for Deeper Losses as BOJ Board Pushes for More Rate Hikes
- Crypto Prices Drop as U.S. Urges Citizens To Leave Iran
- XRP Price Outlook As Peter Brandt Predicts BTC Price Might Crash to $42k
- Will Cardano Price Rise After CME ADA Futures Launch on Feb 9?
- Dogecoin, Shiba Inu, and Pepe Coin Price Prediction as Bitcoin Crashes Below $70K.
- BTC and XRP Price Prediction As Treasury Secretary Bessent Warns “US Won’t Bail Out Bitcoin”
- Ethereum Price Prediction As Vitalik Continues to Dump More ETH Amid Crypto Crash
- Why XRP Price Struggles With Recovery?


